Bitcoin’s price is flashing a rare bearish technical signal as it hovers near $62,400, with its long-term moving averages poised to cross in a pattern analysts call the “death cross.” The potential reversal comes as traders monitor volatility ahead of key macroeconomic data, including this week’s U.S. inflation report and Federal Reserve policy expectations. According to CoinGlass, a leading crypto analytics platform, the signal—when the 50-day moving average falls below the 200-day—has historically preceded prolonged downtrends in Bitcoin’s price.
As of Monday afternoon, Bitcoin was trading at approximately $62,400, down 1.2% over the past 24 hours, according to CoinGecko. The cryptocurrency has faced downward pressure since its all-time high of $73,700 in March, with analysts citing macroeconomic uncertainty, including rising U.S. Treasury yields and Fed rate cut expectations, as key factors. Meanwhile, on-chain data from Glassnode shows Bitcoin’s realized cap—an indicator of long-term holder profitability—has declined by 5% over the past month, signaling potential selling pressure from older coins.
Technical analysts warn that the “death cross” pattern, though rare, has historically preceded significant drawdowns. For example, in 2018, a similar crossover preceded Bitcoin’s drop from $20,000 to $3,200 within 12 months. However, not all crossovers lead to crashes—Bitcoin’s 2021 bull market saw false signals before its eventual rally. The current context differs, with traders now focusing on whether the Fed’s potential rate cuts later this year could offset bearish technicals.
What Is a “Death Cross” and Why Does It Matter?
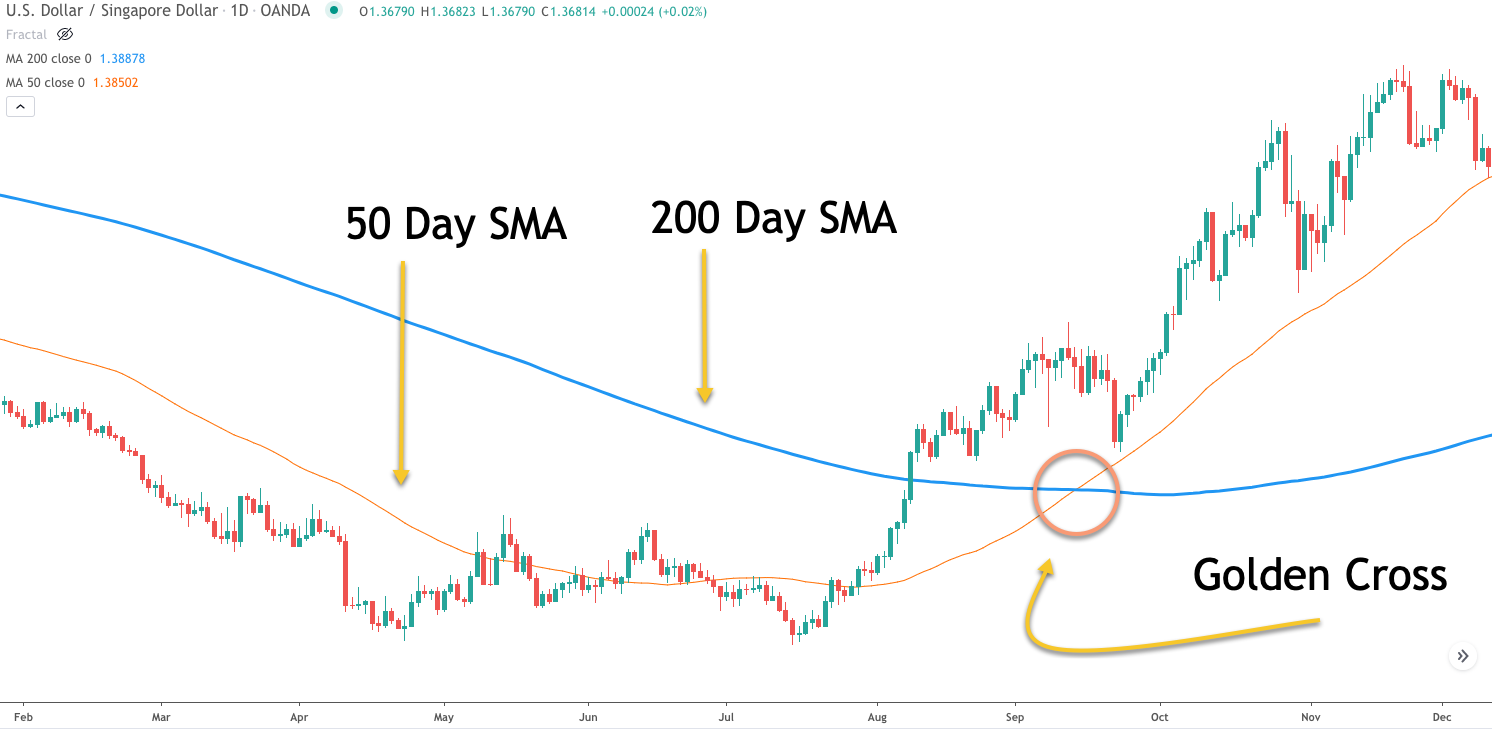
A “death cross” occurs when a cryptocurrency’s short-term moving average (typically 50-day) crosses below its long-term average (200-day). For Bitcoin, this pattern has appeared only five times since 2013, according to TradingView. Each instance has preceded periods of volatility, though the severity of the decline has varied:

- 2014: Bitcoin dropped from $1,100 to $200 within six months.
- 2018: Price fell from $20,000 to $3,200 over 12 months.
- 2021: A false signal appeared before Bitcoin’s rally to $69,000.
This week’s potential crossover differs from past events due to Bitcoin’s current market capitalization—now exceeding $1.2 trillion—and the broader macroeconomic backdrop. Analysts at CoinDesk note that institutional adoption, such as BlackRock’s recent Bitcoin ETF approval, may mitigate downside risks compared to previous cycles.
How Traders Are Reacting: Bullish vs. Bearish Perspectives
Opinions among traders are divided. On one side, Bloomberg Intelligence analysts argue that Bitcoin’s on-chain activity—including rising exchange inflows—suggests accumulation despite the technical signal. “Institutional players are likely using dips to build positions,” said Mike McGlone, Bloomberg’s senior commodity strategist.
Conversely, Reuters reports that retail traders are increasingly using leverage to short Bitcoin, with open interest on derivatives platforms like Binance rising by 15% over the past week. “The death cross is a psychological trigger for short sellers,” said a trader at a major crypto exchange, who requested anonymity. “We’re seeing aggressive bets against further declines.”
Regulatory developments also add uncertainty. The U.S. Securities and Exchange Commission’s ongoing lawsuit against Coinbase and the potential approval of spot Bitcoin ETFs by European regulators could influence price action. According to the Financial Times, European regulators are expected to rule on ETF applications by mid-July, which could inject $10 billion in new capital if approved.
What Happens Next? Key Dates to Watch
Traders are closely monitoring several upcoming events that could shape Bitcoin’s trajectory:
- June 11: U.S. Consumer Price Index (CPI) report, which will influence Fed rate cut expectations.
- June 18: European Central Bank policy decision, with potential implications for Bitcoin’s euro-denominated trading pairs.
- June 25: Deadline for U.S. regulators to rule on spot Bitcoin ETF applications.
Additionally, Bitcoin’s halving event—scheduled for April 2024—remains a long-term catalyst. Historical data from LookIntoBitcoin shows that halving cycles have preceded price surges, though the timing varies. “The next halving could be a bullish trigger, but the death cross suggests near-term caution,” said PlanB, the creator of the Stock-to-Flow model.
Why This Matters for Investors
The current technical setup underscores Bitcoin’s dual nature as both a speculative asset and a hedge against inflation. For institutional investors, the death cross may signal an opportunity to accumulate at lower prices, while retail traders face heightened risk due to leverage exposure. According to a Gemini report, 68% of Bitcoin investors hold positions for over a year, suggesting long-term confidence despite short-term volatility.

For those new to Bitcoin, the death cross serves as a reminder of the asset’s cyclical nature. “Bitcoin’s price is driven by both technical patterns and fundamental adoption,” said Nikhil Wagle, CEO of crypto exchange Uniswap Labs. “While the death cross is a warning sign, it’s not a guarantee of a crash—context matters.”
Frequently Asked Questions
Q: Has a death cross always led to a Bitcoin crash?
A: No. While the pattern has preceded significant declines in the past, Bitcoin’s 2021 rally saw a false signal. The current context—with higher institutional participation—may reduce the downside impact.
Q: Should I sell Bitcoin if the death cross occurs?
A: There’s no one-size-fits-all answer. Short-term traders may use the signal as a cue to take profits or hedge, while long-term holders often view it as a buying opportunity. Always assess your risk tolerance and investment horizon.
Q: How can I track Bitcoin’s moving averages?
A: Use platforms like TradingView, CoinGecko, or CoinDesk for real-time moving average data.
The next critical checkpoint for Bitcoin’s price will be the U.S. CPI report on June 11, which could shift Fed rate expectations and trigger further volatility. For the latest updates, monitor official announcements from the Federal Reserve and regulatory filings from the SEC.
What are your thoughts on Bitcoin’s technical signals? Share your insights in the comments below or join the discussion on Twitter. For more on crypto markets, explore our dedicated coverage.
Worth a look