Decoding the Microbiome: Statistical Approaches to Evaluating SER-109 for Recurrent Clostridioides difficile Infection
Recurrent Clostridioides difficile infection (CDI) presents a critically important clinical challenge, and emerging therapies targeting the gut microbiome offer promising solutions. SER-109 (VOS), an oral microbiome therapy, has demonstrated efficacy in clinical trials. A robust understanding of how VOS achieves this efficacy requires rigorous statistical analysis of its impact on the gut microbiome composition, function, and metabolic outputs. This article details the statistical methodologies employed in evaluating VOS, providing insight into the scientific rigor underpinning its advancement and the nuances of microbiome data analysis. We will explore the pre-planned and post-hoc analyses used to dissect the complex interplay between VOS, the gut microbiome, and clinical outcomes.
Understanding the Analytical Framework: Pre-planned vs. Post-Hoc Approaches
The evaluation of VOS’s impact on the microbiome was guided by a pre-defined statistical analysis plan, ensuring objectivity and minimizing bias. These pre-planned analyses focused on several key areas:
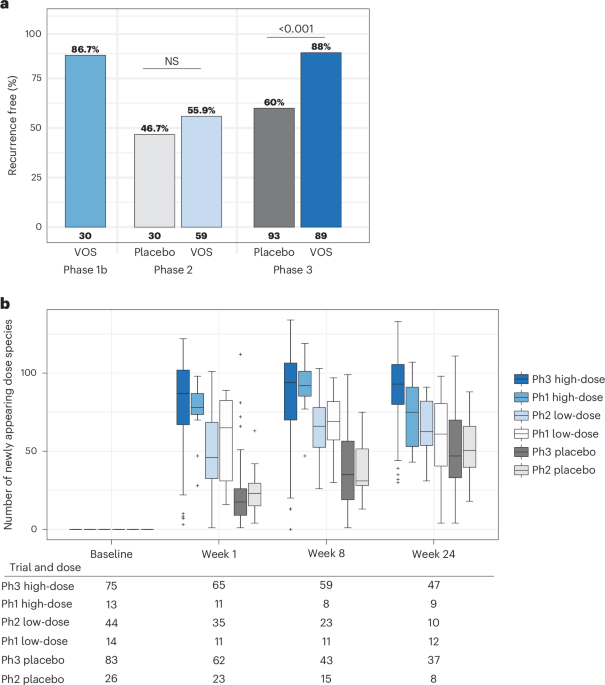
* VOS Dose & Species Engraftment: Assessing the successful colonization of administered bacterial species within the recipient’s gut.
* Microbiome Compositional Shifts: Tracking changes in the relative abundance of different bacterial species over time.
* Bile Acid Concentrations: Measuring alterations in bile acid profiles, crucial metabolites influenced by the microbiome and impacting CDI pathogenesis.
These analyses were conducted on the “safety population” – all patients who received study drug and provided at least one usable stool sample before and after treatment. However, recognizing the dynamic nature of microbiome research and the complexities of clinical trials, a series of post-hoc analyses were also undertaken. These analyses, while consistent with the overall pre-planned strategy, incorporated refinements to enhance the clarity and interpretability of the results.
Addressing Confounding Factors: The Importance of Post-Recurrence Sample Exclusion
A critical refinement in the post-hoc analyses involved the exclusion of stool samples collected after a CDI recurrence requiring antibiotic treatment. This decision was driven by a fundamental understanding of microbiome dynamics: antibiotics profoundly disrupt the gut microbial community, masking the true impact of VOS.
The rationale is straightforward: CDI recurrence is frequently enough treated with antibiotics, which reset the microbiome. including samples collected after antibiotic use would confound the assessment of VOS’s lasting effects. as the placebo group experienced a considerably higher recurrence rate, this exclusion was particularly vital to ensure a fair comparison between VOS and placebo arms. This demonstrates a commitment to data integrity and a nuanced understanding of the challenges inherent in microbiome research.
Statistical Methods Employed: A Deep Dive
A diverse toolkit of statistical methods was utilized to analyze the complex microbiome data generated during the VOS clinical trials.Here’s a breakdown of the key techniques:
* Non-Parametric Statistics: Given the often non-normal distribution of microbiome data, non-parametric methods were favored. Median and interquartile ranges were used to describe the distribution of engraftment rates and secondary bile acid measurements within each treatment group.
* Mann-Whitney U (MWU) Test: This non-parametric test was used to compare VOS and placebo arms at specific timepoints for engraftment, species abundance, and bile acid concentrations.The R statistical environment (version 3.6.3) with the rstatix package (version 0.7.2) facilitated these comparisons.
* Multivariate Analysis - NMDS, PERMANOVA, and PERDISP2: To visualize and quantify overall changes in microbiome community composition, Non-metric Multidimensional Scaling (NMDS) plots were generated. These plots represent the similarity of microbiome profiles between samples.
* PERMANOVA (Permutational Multivariate Analysis of Variance): This test statistically assessed differences in overall community composition between treatment arms at each timepoint.
* PERDISP2: This procedure evaluated sample dispersion, indicating weather the variability within each treatment group’s microbiome was significantly different. the vegan package (version 2.5-6) in R provided the functions (metaMDS, adonis, and betadispers) for these analyses.
* Fisher’s Exact Test with FDR Correction: To identify specific genera that differed in prevalence between treatment arms, fisher’s exact tests were employed. To account for the multiple comparisons inherent in analyzing numerous genera, the False Revelation Rate (FDR) was controlled using the Benjamini-hochberg procedure, minimizing the risk of false positive findings
Related reading
- Iceberg Shape Linked to Massive Emperor Penguin Chick Decline in Antarctica
- Measles Outbreak Prevention and Multivaccination Campaigns in Brazil: What You Need to Know
- New Study Links GLP-1 Medications Like Wegovy and Ozempic to Health Risks (archyde.com)
- Google AI Overviews: Impact on Publishers and the AI Opt-Out Dilemma (archynewsy.com)