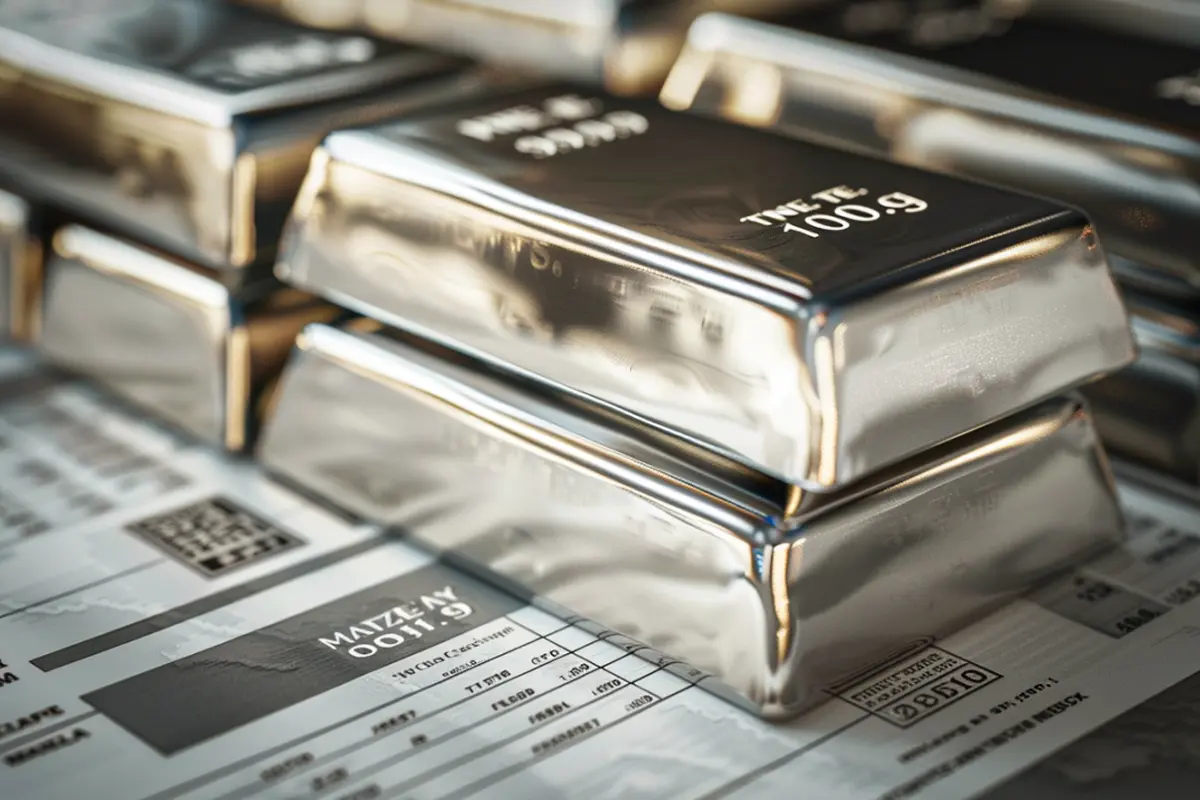
The precious metals market saw a significant shift on Wednesday, April 8, 2026, as the price of silver surged amid a shifting geopolitical landscape. Investors reacted quickly to news of a ceasefire between the United States and Iran, a development that sparked a relief rally across multiple asset classes and set downward pressure on the U.S. Dollar.
This weakening of the greenback provided a direct tailwind for the silver spot price, which climbed as the inverse relationship between the dollar and precious metals intensified. By 18:09 UTC, the mid-market exchange rate for silver reached 1 XAG to 75.3288 USD, marking one of the strongest sessions for the metal this week.
The rally was not isolated to silver. The broader market experienced a “relief rally,” with equity markets surging and oil futures sinking below $100 a barrel as the threat of escalation in the Middle East subsided. For silver traders, the combination of a retreating dollar and renewed risk appetite has created a volatile but bullish environment.
Geopolitical Catalysts and the Dollar Connection
The primary driver behind the current market movement is the ceasefire between the U.S. And Iran. In the world of global finance, the U.S. Dollar often acts as a “safe haven” during times of intense geopolitical conflict. When tensions rise, demand for the dollar typically increases, which can suppress the price of commodities priced in USD, such as silver.

However, the announcement of a ceasefire reduced the immediate perceived risk of conflict, leading investors to move away from the dollar and back into commodities and equities. As the dollar weakened, silver became cheaper for buyers holding other currencies, fueling the demand that pushed the price higher.
This dynamic is a cornerstone of macroeconomic analysis. When the U.S. Dollar index declines, it typically lowers the barrier for international investment in silver, which is traded globally under the ticker XAG. The current jump in value reflects a market recalibrating its risk assessment in real-time.
Technical Analysis: Support and Resistance Levels
From a technical perspective, silver is showing signs of a bullish recovery. Market analysts have identified strong support at the 69.31 level, which served as a foundation for the recent bounce. As the price climbs, traders are now eyeing several key resistance zones that could determine the next phase of the rally.
According to data from TradingView, the key resistance levels to watch are 79.93, 89.63, and 95.93. If silver can break through these levels without significant pullbacks, some analysts suggest a top target could reach as high as 121.63. Conversely, the ability of the metal to hold its current support levels will be critical in maintaining this upward momentum.
For institutional and retail investors, these zones represent potential “breakout opportunities” or areas where the price may encounter selling pressure. The current trajectory suggests a strong recovery, provided the geopolitical stability holds and the dollar continues its current trend.
Silver Price Conversion Table (April 8, 2026)
| Silver Ounces (XAG) | US Dollars (USD) |
|---|---|
| 1 XAG | 75.3288 USD |
| 10 XAG | 753.288 USD |
| 100 XAG | 7,532.88 USD |
| 1,000 XAG | 75,328.8 USD |
Broader Market Implications: Oil and Equities
The silver surge is part of a wider trend affecting global commodities. The ceasefire has had a profound impact on the energy sector, with oil futures diving below $100 a barrel. This suggests that the “war premium”—the extra cost added to oil prices due to the risk of supply disruptions in the Middle East—is evaporating.
Simultaneously, stocks have surged as the relief rally takes hold. Investors are shifting their portfolios from defensive positions (like cash and government bonds) toward growth assets. Silver often occupies a unique space in these portfolios, acting as both a precious metal hedge and an industrial commodity, making it sensitive to both geopolitical stability and economic growth.
The synchronization of these moves—falling oil, rising stocks, and a climbing silver price—points to a market that is rapidly pricing in a period of decreased volatility. However, the sustainability of this rally depends heavily on the permanence of the ceasefire and the subsequent moves by central banks regarding interest rates and currency valuation.
Key Takeaways for Investors
- Dollar Inverse Correlation: The decline in the U.S. Dollar following the U.S.-Iran ceasefire directly contributed to the rise in silver prices.
- Current Valuation: As of April 8, 2026, the mid-market rate for silver is 75.3288 USD per ounce.
- Technical Outlook: Bullish recovery is underway with strong support at 69.31 and key resistance targets at 79.93, 89.63, and 95.93.
- Intermarket Connection: The rally coincides with a broader market relief rally, characterized by surging equities and oil dropping below $100.
As the market continues to digest the implications of the ceasefire, traders will be monitoring the XAG/USD pair for any signs of a reversal or further acceleration. The next major checkpoint for the markets will be the continued monitoring of the ceasefire’s adherence and any subsequent official diplomatic updates from Washington and Tehran.
We invite our readers to share their insights on the current precious metals trend in the comments below. How is the shifting geopolitical climate affecting your investment strategy?
Related reading