College football programs entering games as betting favorites have maintained a consistent success rate over the last decade, though the margin of victory and frequency of upset losses vary significantly across conferences. Between 2016 and 2025, favorites in major college football matchups secured victories at a rate of approximately 75% to 80%, according to historical betting data aggregated by NCAA sports reporting. While the probability of a favorite winning remains high, the volatility of the sport—driven by roster turnover and the implementation of the expanded College Football Playoff—has influenced how oddsmakers set lines in recent seasons.
Historical Trends in Betting Favoritism
The winning percentage of college football favorites is rarely static, as it fluctuates based on the disparity in talent between opponents. From 2016 through the 2025 season, data tracking indicates that heavy favorites—those laying more than 14 points—won outright roughly 90% of the time. However, the “point spread” serves as a measure of expected performance rather than a guarantee of victory. According to Sports Reference CFB, the rise in parity across the Power Four conferences has seen a slight compression in the success rate of favorites when the spread is less than a touchdown.
This trend is often attributed to the increased frequency of high-stakes games where “upsets” are statistically more likely due to the intensity of conference scheduling. During the 2023 and 2024 seasons, the introduction of more rigorous conference rotations led to a notable uptick in instances where ranked teams struggled to cover spreads against unranked opponents. Analysts note that while the favorite often secures the win, the “covering” of the spread—the margin by which they win—is where the most significant variance occurs.
The Impact of Roster Volatility and Coaching Changes
One of the primary drivers of betting outcomes in college football over the last ten years has been the shift in roster management. The liberalization of transfer rules and the expansion of Name, Image, and Likeness (NIL) collectives have changed how teams prepare for individual matchups. As reported by the Associated Press, programs with high rates of transfer portal activity often see greater fluctuations in their weekly performance, making them harder for oddsmakers to price accurately.
When a team is favored, the expectation is that their depth chart and coaching infrastructure will overcome the opponent’s individual talent. However, the data from the 2020 COVID-shortened season through 2025 shows that teams with significant coaching turnover often underperform as favorites early in the season. This “coaching adjustment” period is a documented factor that affects betting lines, as oddsmakers must balance historical team success against the uncertainty of new personnel.
Comparative Analysis: Favorites vs. Underdogs
To understand the performance of favorites, one must look at the inverse: the success of the underdog. While favorites win the majority of games, the “moneyline” underdog pulls off an outright win in roughly 20% to 25% of contests annually. This percentage has remained relatively stable over the past decade, despite the shifting landscape of college football conferences and the realignment of major programs into new leagues.
| Metric | Average Performance (2016-2025) |
|---|---|
| Favorite Outright Win % | ~78% |
| Underdog Outright Win % | ~22% |
| Heavy Favorite (>14 pts) Win % | ~90% |
The data suggests that the “home-field advantage” remains a significant variable for oddsmakers. When a favorite is playing on the road, their win percentage drops by approximately 4% compared to when they are playing in their own stadium, as noted in statistical reviews by Fox Sports. This home-field factor is a constant in betting models that seek to account for crowd noise, travel fatigue, and the inherent difficulty of winning in hostile environments.
What Happens Next in College Football Betting
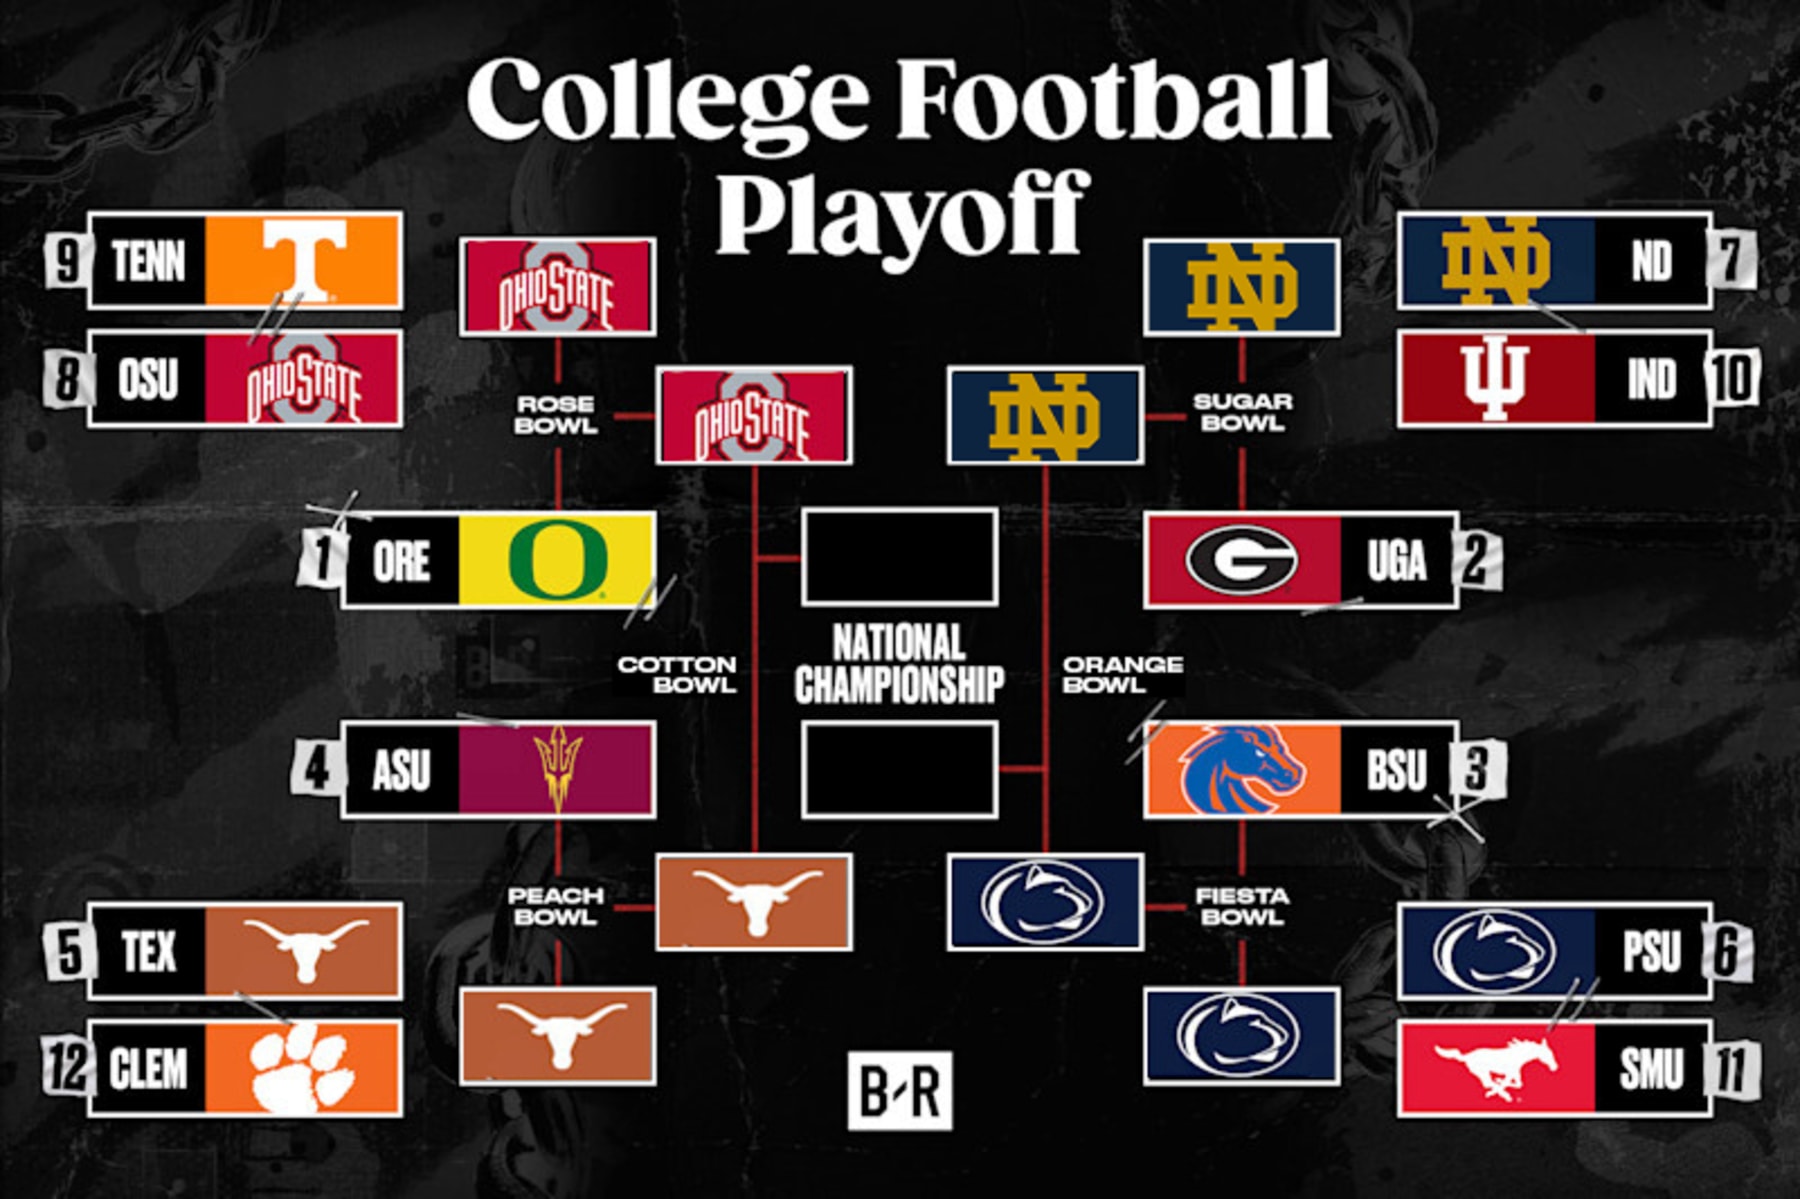
The betting landscape is expected to evolve further as the College Football Playoff continues to expand. With more teams remaining in contention late into the season, the number of games featuring highly motivated favorites versus desperate underdogs is likely to increase. This shift will force oddsmakers to place a higher premium on late-season motivation and health reports, factors that are notoriously difficult to quantify.
As we move toward the 2026 season, bettors and analysts are looking toward the next official release of conference strength-of-schedule metrics to determine how lines will be set for marquee matchups. For fans and observers interested in the latest developments, the NCAA and major sports news outlets will provide updated statistical breakdowns following the conclusion of the spring practice period and the finalization of fall rosters. We invite readers to share their observations on how recent roster changes have affected their favorite teams’ performance in the comments section below.