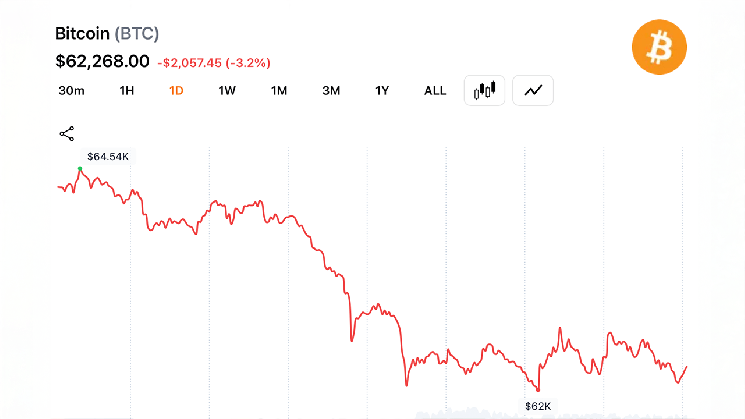
Bitcoin’s price dipped below $64,500 on June 22, testing trader confidence in the $62,000 support level, which analysts and institutional investors are now actively defending amid market volatility. The decline followed a period of consolidation, with the world’s largest cryptocurrency by market cap trading as low as $61,860 before a partial recovery, according to real-time data from CoinDesk and CoinMarketCap. The move has sparked debate among traders about whether the $62,000 threshold will hold or if further declines could trigger a deeper correction.
While Bitcoin’s short-term outlook remains uncertain, traders and analysts are pointing to technical indicators, on-chain activity, and macroeconomic factors as key influences. The $62,000 level has gained significance as a psychological and technical support zone, with some market participants describing it as a “last line of defense” against further downside pressure. Meanwhile, institutional players—including major exchange operators and asset managers—are reportedly monitoring liquidity levels closely.
This article examines the factors driving Bitcoin’s latest price action, the role of the $62,000 support level, and what traders and analysts are saying about the cryptocurrency’s near-term trajectory.
Why Is the $62,000 Level So Critical for Bitcoin?
The $62,000 mark has emerged as a focal point for Bitcoin traders due to a combination of technical analysis and market psychology. According to Glassnode, a blockchain analytics firm, the level corresponds to a confluence of historical price action and liquidity clusters. Specifically:

- Technical Support: The $62,000 zone aligns with a Fibonacci retracement level and a prior swing low from earlier this year, making it a natural area for stop-loss orders and buying interest.
- Institutional Activity: Large-scale traders, including those managing Bitcoin futures and spot positions, have historically shown increased activity around this price, suggesting it acts as a “magnet” for both buying and selling pressure.
- Market Sentiment: Social media chatter and trader forums indicate that the $62,000 level is being treated as a “make or break” threshold. A breach below this level could trigger a cascade of liquidations, particularly among leveraged traders.
Reuters reported earlier this week that some hedge funds and asset managers have set automated trading rules to defend the $62,000 level, viewing it as a critical juncture for Bitcoin’s next major move. “If $62,000 holds, we could see a short-term rebound toward $65,000,” said a source familiar with the trading strategies of several firms, adding that a breakdown below this level would signal a more bearish outlook.
What Triggered Bitcoin’s Latest Drop Below $64,500?
Bitcoin’s price action on June 22 was influenced by a mix of technical, macroeconomic, and liquidity-related factors. Key drivers include:
- Profit-Taking After Recent Rally: Bitcoin had surged to over $67,000 earlier in June, prompting some traders to take profits ahead of what many anticipated would be a period of consolidation. According to CoinMetrics, the unrealized profit/loss ratio for Bitcoin holders has been declining, suggesting that early adopters and long-term investors may be reducing exposure.
- Macroeconomic Uncertainty: Concerns about U.S. inflation data, Federal Reserve policy expectations, and global economic growth have contributed to risk-off sentiment in financial markets. Bitcoin, often viewed as a “risk asset,” has been particularly sensitive to shifts in investor confidence. The U.S. Consumer Price Index (CPI) report released earlier this month showed persistent inflation, which some analysts believe could delay Fed rate cuts, weighing on risk assets.
- Liquidity Constraints: Reduced trading volumes on major exchanges, particularly in the spot market, have made Bitcoin more susceptible to sharp price swings. Data from Kaiko indicates that liquidity has tightened in the $62,000–$65,000 range, meaning even modest selling pressure can lead to significant price declines.
Additionally, the recent approval of Bitcoin exchange-traded funds (ETFs) in the U.S. has led to increased institutional participation, but some traders note that the flow of new capital has not been sufficient to offset recent selling pressure. “The ETF inflows have been strong, but they haven’t been enough to prevent the recent pullback,” said Michael Sonnenshein, CEO of Grayscale, in a recent interview with Bloomberg.
How Are Traders Reacting to the $62,000 Support Level?
Traders and analysts are divided on whether the $62,000 level will hold or if further declines are likely. Here’s a breakdown of the prevailing views:
- Bullish Perspective: Some traders argue that the $62,000 level is a “strong support zone” due to its alignment with historical price action and the presence of large buy orders. “If Bitcoin holds above $62,000, we could see a retest of $65,000 in the coming days,” said a technical analyst on TradingView, citing accumulation at lower levels.
- Bearish Perspective: Others warn that a breakdown below $62,000 could trigger a deeper correction, potentially targeting $60,000 or lower. “The lack of volume on the upside suggests that the rally may be losing steam,” noted a market commentator in a recent Coindesk article. “A close below $62,000 would be a clear bearish signal.”
- Neutral/Wait-and-See: Many traders are adopting a cautious approach, waiting for clearer signals before making aggressive moves. “We’re in a range-bound market right now,” said a derivatives trader at a major exchange. “Until we see a decisive breakout or breakdown, it’s best to stay on the sidelines.”
On-chain data from Glassnode shows that Bitcoin’s realized market cap has been declining, indicating that older coins (held for longer periods) are being sold. This could suggest that long-term holders are reducing their exposure, which may contribute to downward pressure on the price.
What Happens Next? Key Scenarios for Bitcoin’s Price
Based on current market conditions and trader sentiment, three potential scenarios are emerging for Bitcoin’s near-term price action:

- Scenario 1: Support Holds at $62,000
If Bitcoin stabilizes above $62,000, traders anticipate a rebound toward $65,000–$67,000, driven by accumulation at lower levels and potential buying interest from ETF inflows. Technical indicators such as the Relative Strength Index (RSI) suggest that the asset is oversold, which could fuel a short-term bounce.
- Scenario 2: Breakdown Below $62,000
A sustained close below $62,000 could trigger a deeper correction, potentially targeting $60,000 or even $58,000, depending on market liquidity and trader sentiment. Historical data shows that Bitcoin has struggled to hold support in similar ranges during previous market cycles.
- Scenario 3: Consolidation Continues
If neither scenario plays out, Bitcoin may continue to trade within a tight range ($62,000–$65,000) as traders await clearer catalysts, such as macroeconomic data or regulatory developments. This could lead to increased volatility but limited directional movement.
Regulatory developments remain a wild card. The U.S. Securities and Exchange Commission (SEC) has been monitoring crypto markets closely, and any unexpected actions—such as enforcement against major exchanges or new reporting requirements—could impact Bitcoin’s price. As of now, the SEC has not announced any imminent regulatory changes, but traders are keeping a close eye on potential developments.
Where to Find Updates on Bitcoin’s Price and Market Trends
For real-time updates on Bitcoin’s price and market trends, readers can refer to the following authoritative sources:

- CoinDesk Bitcoin Price Tracker
- CoinMarketCap Bitcoin Market Data
- Glassnode On-Chain Analytics
- Kaiko Market Liquidity Data
- Reuters Crypto News
Additionally, traders can monitor Bitcoin’s price action on platforms like TradingView for technical analysis and CoinMetrics for macroeconomic insights.
Key Takeaways: What Traders Need to Know
- The $62,000 level is a critical support zone for Bitcoin, with traders and analysts closely monitoring whether it will hold.
- Recent price declines have been driven by profit-taking, macroeconomic uncertainty, and liquidity constraints.
- On-chain data suggests that long-term holders are reducing exposure, which could contribute to further downside pressure.
- Three potential scenarios are emerging: a rebound to $65,000–$67,000, a breakdown below $62,000, or continued consolidation.
- Regulatory developments remain a key risk factor for Bitcoin’s near-term outlook.
The next major catalyst for Bitcoin’s price could come from upcoming economic data, including the U.S. jobs report scheduled for July 5. Traders will also be watching for updates on Bitcoin ETF inflows and any potential regulatory actions from the SEC.
For now, the focus remains on whether Bitcoin can defend the $62,000 support level. If it does, the path to $65,000 may reopen. If not, a deeper correction could be on the horizon.
What are your thoughts on Bitcoin’s latest price action? Share your insights in the comments below or tag us on Twitter.