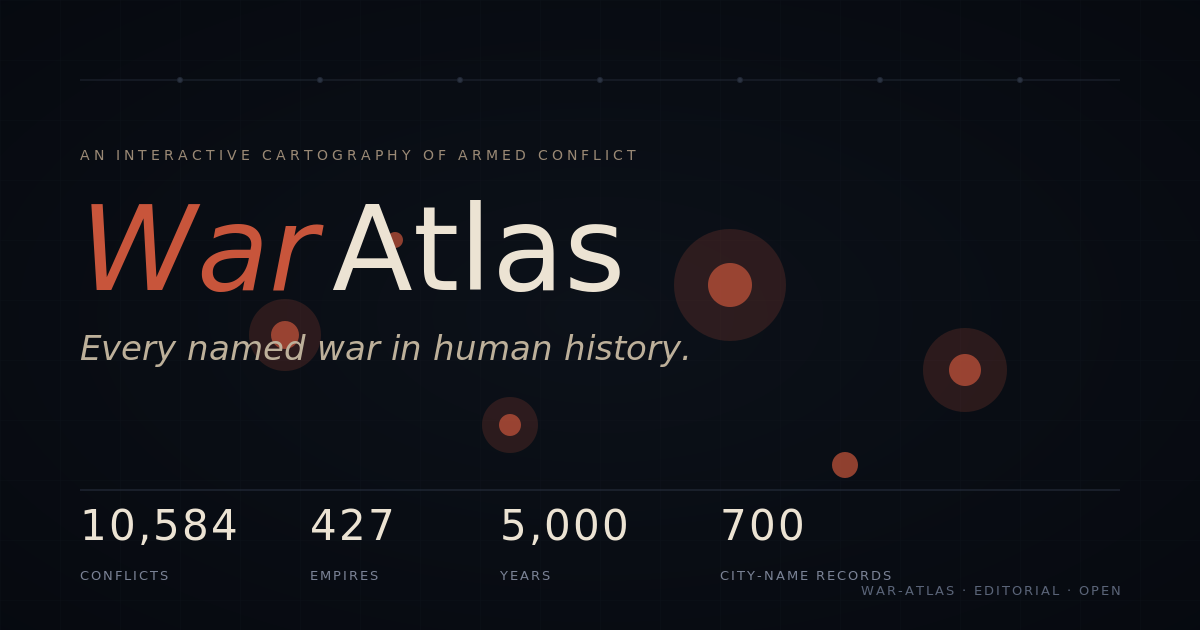
The War Atlas is an ambitious digital initiative designed to provide a comprehensive, interactive cartography of every named armed conflict in human history. By aggregating historical data into a spatial and temporal map, the project aims to visualize the global prevalence of warfare across millennia. The initiative serves as a centralized resource for researchers, students, and the public to examine the geographic patterns of human conflict through a data-driven lens.
As a technology editor, I often look at how we translate complex, sprawling datasets into accessible tools. The War Atlas stands out because it attempts to solve a significant problem in historical study: the lack of a standardized, visual, and searchable database for global conflict history. The platform allows users to filter by time period, region, and conflict type, effectively turning abstract historical records into a dynamic interface.
Data Integration and Historical Mapping
The primary utility of the War Atlas lies in its ability to synthesize disparate academic sources into a single, cohesive view. According to the Correlates of War Project, which serves as a foundational dataset for many such initiatives, tracking the “who, when, and where” of combat requires rigorous vetting of historical archives. The War Atlas builds upon this type of quantitative research, applying geospatial mapping software to plot the locations of battles, sieges, and territorial skirmishes.
By using modern web technologies—specifically geographic information system (GIS) frameworks—the developers behind such projects create an interactive experience that traditional textbooks cannot replicate. Users can zoom in on specific regions, such as the Mediterranean or the Korean Peninsula, to see how the intensity of conflict has shifted over centuries. This technological approach allows for a clearer understanding of the “theaters of war,” showing how topography and resource distribution have historically influenced the location of major confrontations.
The Challenges of Quantifying Human Conflict
Defining what constitutes a “named war” remains a significant challenge for historians and data scientists alike. The threshold for what is included in a dataset can vary widely. For instance, the Uppsala Conflict Data Program (UCDP) uses a strict definition of organized violence, requiring a minimum of 25 battle-related deaths per year to categorize an event as a conflict. When building a tool like the War Atlas, developers must reconcile these varying academic standards to ensure the map remains accurate and representative.
This ambiguity often leads to debates regarding the scope of such projects. Critics and scholars often point out that “named” wars frequently exclude smaller, localized insurgencies or civil unrest that did not reach a specific casualty threshold. The War Atlas attempts to mitigate this by providing citations for each entry, allowing users to see the source material behind the classification. This transparency is essential for maintaining the project’s credibility in an era where data-driven history is increasingly used for political and educational purposes.
Educational Utility and Future Developments
For educators, the War Atlas offers a way to teach history through a spatial perspective. Rather than memorizing dates, students can observe the movement of borders and the expansion of empires by interacting with the map. This shift from rote memorization to spatial analysis is a hallmark of current pedagogical trends in digital humanities. The platform is frequently updated as new historical records are digitized and verified, making it a living archive rather than a static document.
The project is currently working on integrating more granular data regarding the socio-economic impacts of these conflicts. Future iterations of the map are expected to include layers that show changes in trade routes, population displacement, and technological shifts that occurred in the wake of major wars. As these datasets continue to grow, the War Atlas will likely become a primary tool for studying the long-term consequences of conflict on human development.
The project team continues to solicit feedback from historical societies and academic institutions to refine the accuracy of their entries. Users interested in the methodology or looking to contribute to the ongoing verification process can find official documentation on the project’s portal. For those interested in the latest updates, the next technical audit of the database is scheduled for late 2024, with a focus on improving the mobile responsiveness of the interactive interface.
Do you have thoughts on how digital mapping is changing the way we study history? I encourage you to share your perspective in the comments below as we continue to track the evolution of these important digital tools.