Personalized Perioperative Treatment: A Cost-Effectiveness Analysis for Enhanced Patient Outcomes
This article details a rigorous cost-effectiveness analysis comparing a personalized perioperative treatment strategy to standard care, focusing on patients undergoing treatment for rectal and pelvic cancers (RCC & PCC). Our research demonstrates the potential for significant improvements in patient outcomes and value through a data-driven, individualized approach. We’ll break down the methodology, key considerations, and findings, providing a clear understanding of the benefits of this innovative treatment pathway.
Understanding the Challenge & Our Approach
Traditionally, perioperative care has followed standardized protocols. Though, patients respond differently to treatment, and a “one-size-fits-all” approach can lead to suboptimal outcomes and increased costs. We aimed to determine if tailoring treatment based on individual risk profiles – specifically, predicting the likelihood of uncomplicated versus complicated recovery trajectories – could improve both health outcomes and economic efficiency.
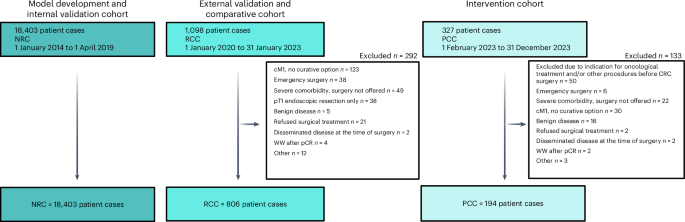
Our analysis leveraged data from both Rectal Cancer Centers (RCC) and Pelvic Cancer Centers (PCC) to build a probabilistic model. This model accounted for inherent uncertainties in predicting patient trajectories and incorporated real-world healthcare costs.
Risk Stratification & Predicted Impact
Patients were categorized into four risk groups (A-D). The personalized treatment strategy demonstrably altered the probability of experiencing complicated recovery trajectories within each group:
* Risk Group A: 5% increase in complicated trajectories.
* Risk Group B: 40% decrease in complicated trajectories.
* Risk Group C: 16% decrease in complicated trajectories.
* Risk Group D: 51% decrease in complicated trajectories.
This shift in trajectory distribution – moving patients towards less complicated recoveries – is the core difference between the personalized approach and standard care, beyond the implementation costs of the intervention itself.
Modeling & Economic Evaluation
We employed a probabilistic sensitivity analysis to comprehensively address parameter uncertainty. This generated complication combinations for each risk stratum under both treatment strategies.
Here’s a breakdown of the key elements of our economic evaluation:
* Outlook: An extended healthcare sector perspective was adopted, encompassing all relevant costs – inpatient care, outpatient visits, general practitioner (GP) consultations, and prescription medications.
* Outcome Measure: Quality-adjusted Life Years (QALYs) were calculated by adding days alive during the study period to utility scores derived from EQ-5D-5L questionnaires.
* Costing: All costs were based on 2023 Danish prices.
* Hospital Care: Danish Diagnose-Related Group (DRG) tariffs were utilized (DNPR).
* GP Visits: Base tariffs established by the Organization of General Practitioners and the Regional Board of Salaries and Fees.
* Medications: Drug prices sourced from the Danish Medicines Agency (DPR)48.
* Intervention Costs: Included the decision support tool hosting, system administrator salaries, staff time, and necessary equipment.
* Health effects: Utility scores, obtained from 139 patients at the PCC, were adjusted downwards for inpatient stays and complicated trajectories. Importantly, the total health effect was assumed equivalent between treatment arms, but distributed differently due to the altered trajectory probabilities.
Key Findings & Implications
Based on the estimated costs and QALYs, the incremental cost-effectiveness ratio (ICER) was calculated to compare the personalized perioperative treatment to standard care. (Detailed results are available in the Supplementary Information - see links below).
Our analysis suggests that personalized perioperative treatment offers a compelling value proposition. By proactively identifying and mitigating risks, we can potentially reduce complications, improve patient quality of life, and optimize resource allocation within the healthcare system.
Transparency & Further Information
We are committed to transparency and reproducibility. Detailed information regarding the model,data sources,and supplementary tables can be found at:
* Supplementary Information: http://www.nature.com/articles/s41591-025-03942-x#Sec32
* Supplementary Tables 3-5: [http://www.nature.com/articles/s41591-025-03942-x#MOESM3](http://www.nature.