
Bitcoin SV (BSV) continues to navigate a period of significant volatility, with its current price hovering around the USD $15.91 to $16.05 range. While the asset has experienced brief periods of recovery, it remains under substantial long-term pressure, reflecting a broader struggle to regain the momentum seen in previous market cycles.
The digital asset’s recent price action highlights a fragile equilibrium between buyers and sellers. According to real-time market data, Bitcoin SV has seen a 24-hour trading range between a low of $15.28 and a high of $16.66, indicating a state of flux as traders react to shifting sentiment within the broader Bitcoin ecosystem.
For global investors, the Bitcoin SV price performance serves as a case study in extreme cryptocurrency volatility. Despite minor daily fluctuations, the asset is currently trading far below its historical peaks, struggling to maintain stability amid fluctuating trading volumes and a challenging macroeconomic environment for altcoins.
Current Market Valuation and Liquidity
As of the latest reporting, Bitcoin SV maintains a market capitalization of approximately USD $318.52 million to $319.05 million. This valuation places it among the top 100 cryptocurrencies by market cap, though it occupies a much smaller footprint than its primary counterparts in the blockchain space.
Liquidity remains a key point of analysis for BSV. The 24-hour trading volume is currently recorded at USD $26.4 million. With a volume-to-market cap ratio of 8.28%, the asset shows moderate liquidity, though This represents often insufficient to trigger a sustained bullish breakout without a significant catalyst.
The circulating supply of Bitcoin SV is currently 20.01 million BSV, which is identical to its total supply. This transparency in supply helps investors calculate the fully diluted valuation (FDV), which currently aligns with the market cap at approximately $318.52 million to $319.05 million.
Historical Context: From Peaks to Troughs
To understand the current state of BSV, one must examine its dramatic price trajectory over the last several years. The asset reached its all-time high on April 16, 2021, peaking at USD $491.64. From that zenith, the asset has seen a precipitous decline, currently trading at a fraction of its peak value.
The downward trend is stark when viewed through different time horizons. Data indicates a 5-year decline of 93.35% and a 1-year drop of 41.17%. Even in the shorter term, the asset has struggled, with a 6-month return of -37.64% and a year-to-date (YTD) performance of -7.88%.
Conversely, the asset recently touched its all-time low on February 6, 2026, hitting USD $11.81. The subsequent recovery to the $15.90 range represents a 34.72% increase from that floor, though this “rally” is viewed by many analysts as a corrective bounce rather than a fundamental trend reversal.
BSV Price Performance Summary
| Metric | Value (USD) | Date/Period |
|---|---|---|
| All-Time High | $491.64 | April 16, 2021 |
| All-Time Low | $11.81 | February 6, 2026 |
| Current Price (Approx.) | $15.91 – $16.05 | April 7, 2026 |
| 5-Year Change | -93.35% | Cumulative |
Technical Infrastructure and Mining
Bitcoin SV operates as a Proof-of-Perform (PoW) cryptocurrency, meaning users are able to generate BSV through the process of mining. This mechanism requires computational power to secure the network and validate transactions, aligning it with the original technical philosophy of the Bitcoin ecosystem from which it diverged.
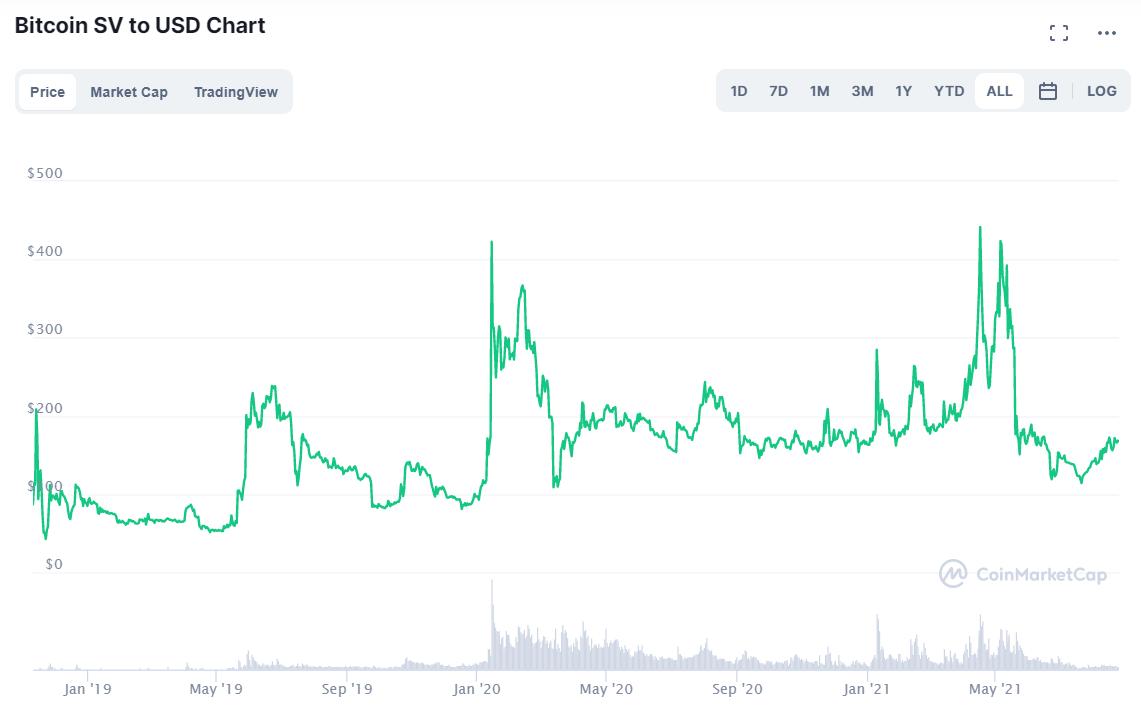
The project’s goal has historically been to maintain the original vision of Bitcoin as a scalable payment system. However, the market’s response has been mixed, as the asset competes with other Layer 1 solutions and the dominant Bitcoin (BTC) network. This competition is reflected in the price volatility and the difficulty BSV faces in attracting sustained institutional volume.
What This Means for Investors
The current price movement of Bitcoin SV suggests a market that is undecided. While the recovery from the February all-time low provides a psychological support level, the overall YTD decline of 7.88% indicates that the bearish sentiment remains the dominant force.
For those monitoring the digital asset space, the key indicators to watch will be the trading volume and the ability of BSV to break above the $16.66 resistance level seen in recent 24-hour trading. Without an increase in active utility or a significant shift in market sentiment, BSV is likely to continue trading within this narrow, volatile range.
Investors are encouraged to monitor official blockchain explorers, such as whatsonchain.com, to track network activity and wallet movements, which often precede price shifts in low-liquidity assets.
The next critical checkpoint for Bitcoin SV will be the upcoming monthly market close, which will determine if the asset can maintain its position above the $15.00 support level or if it will slide back toward its February lows. We will continue to monitor the volume and price action as new data emerges.
Do you believe Bitcoin SV can reclaim its position in the market, or is the downward trend permanent? Share your analysis in the comments below.
Worth a look