Medicaid Expansion & Spending: What the Data Reveals
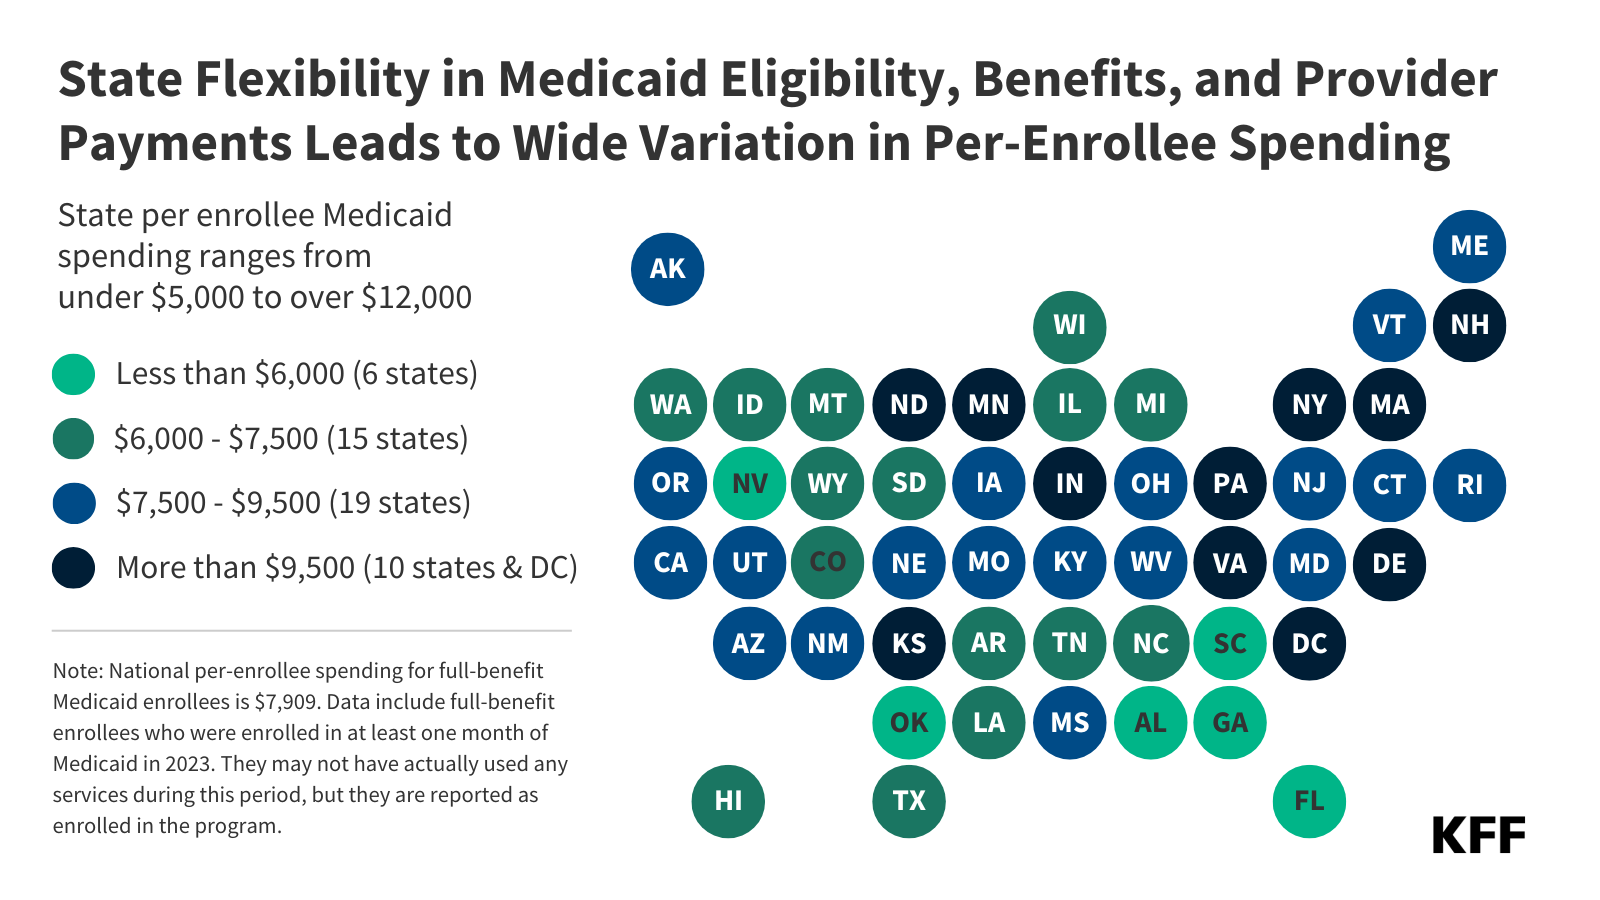
Recent analysis of Medicaid spending data reveals a significant trend: states that have expanded Medicaid are spending more per enrollee than those that haven’t – and this holds true across all eligibility groups. This challenges some prior assumptions about where expansion dollars are going and offers valuable insights for policymakers and healthcare stakeholders. Let’s break down what the numbers mean for you and your understanding of the Medicaid landscape.
Higher Per-Enrollee Costs in Expansion States
On average, expansion states spend $8,444 per Medicaid enrollee. This is nearly $1,000 more than the $7,591 spent per enrollee in non-expansion states (based on data from 2023). This difference isn’t limited to the newly eligible adults covered by expansion.
Some argued that the generous 90% federal matching rate for expansion adults might lead states to prioritize spending on this group. However, the data shows increased spending across the board. Here’s a closer look:
* Individuals with Disabilities: Expansion states spend an average of $29,259 per enrollee, compared to $19,289 in non-expansion states.
* Older Adults: Spending reaches $22,350 per older adult enrollee in expansion states, versus $18,288 in non-expansion states.
* Children & Parents: Even for traditional Medicaid populations, expansion states demonstrate higher per-enrollee spending.
[Image of Per-Enrollee Spending in States That Expanded Medicaid Is Higher for all Eligibility Groups Than in Non-Expansion States]
(Data Source: KFF State Health Facts,CY 2023)
Why the Difference?
these spending variations aren’t necessarily indicative of better care,but rather reflect a complex interplay of factors. Consider these potential drivers:
* State Policy Choices: States have autonomy in determining benefits, eligibility criteria, and provider payment rates.
* Regional Healthcare Costs: The cost of healthcare varies considerably across the country.
* State Demographics: Population health profiles and the prevalence of chronic conditions influence spending.
* Increased Utilization: Expansion may lead to increased healthcare utilization as more people gain access to care.
Understanding the Data: Methodology
It’s critically important to understand how these figures were calculated. Here’s a quick overview:
* Data Source: The KFF State Health Facts database, utilizing data from the T-MSIS Research identifiable Demographic-Eligibility and Claims Files (T-MSIS data).
* Enrollee Definition: “Full-benefit enrollees” are defined as those enrolled in Medicaid for at least one month with full benefits, or those who received at least one month of benefits through a benchmark equivalent coverage package. It’s critically important to note this includes individuals who may not have used services during that period, but were eligible.
* Spending Calculation: Total spending was determined by summing all claims per full-benefit enrollee within the T-MSIS claims files.
* Dual Eligibles: Data excludes Medicare Savings Programme (MSP) enrollees, focusing solely on full-benefit enrollees.
What This Means for You
whether you’re a healthcare professional, policymaker, or simply interested in the future of healthcare, these findings are crucial. They demonstrate that Medicaid expansion isn’t just about covering more people; it’s also impacting how states allocate healthcare resources.
Understanding these trends is vital for informed discussions about Medicaid’s sustainability, equitable access to care, and the overall health of our communities. Continued monitoring and analysis of this data will be essential as the Medicaid landscape evolves.
Resources:
* KFF State Health Facts on Medicaid Spending
* [Paragon Institute: The Politics of Medicaid Reform](https://paragoninstitute.org/
Related reading
- What is Hare Fever? New York Issues Alert Over Tick-Borne Illness
- Philippines Expands School Mental Health Workforce to Address Student Crisis
- Medicaid Halts in California and Minnesota Spark Outrage for Caregivers and Disabled People (news-usa.today)
- Man Shot in Neck on East State Street in Trenton (archyde.com)