The Uneven Distribution of Home Equity Among Medicare Beneficiaries: A Deep Dive
Home equity represents a significant,ofen overlooked,component of wealth for many Americans,particularly as they approach retirement.Though, a recent analysis reveals substantial disparities in home equity accumulation among Medicare beneficiaries, influenced by factors like age, race, ethnicity, gender, marital status, and education. Understanding these differences is crucial for crafting effective policies that support financial security in later life. This article breaks down the key findings and what they mean for you.
Key Findings: A Snapshot of Home equity
The data, detailed in accompanying tables (see Appendix Table 1), paints a clear picture: home equity isn’t distributed equally. Here’s a breakdown of the major trends:
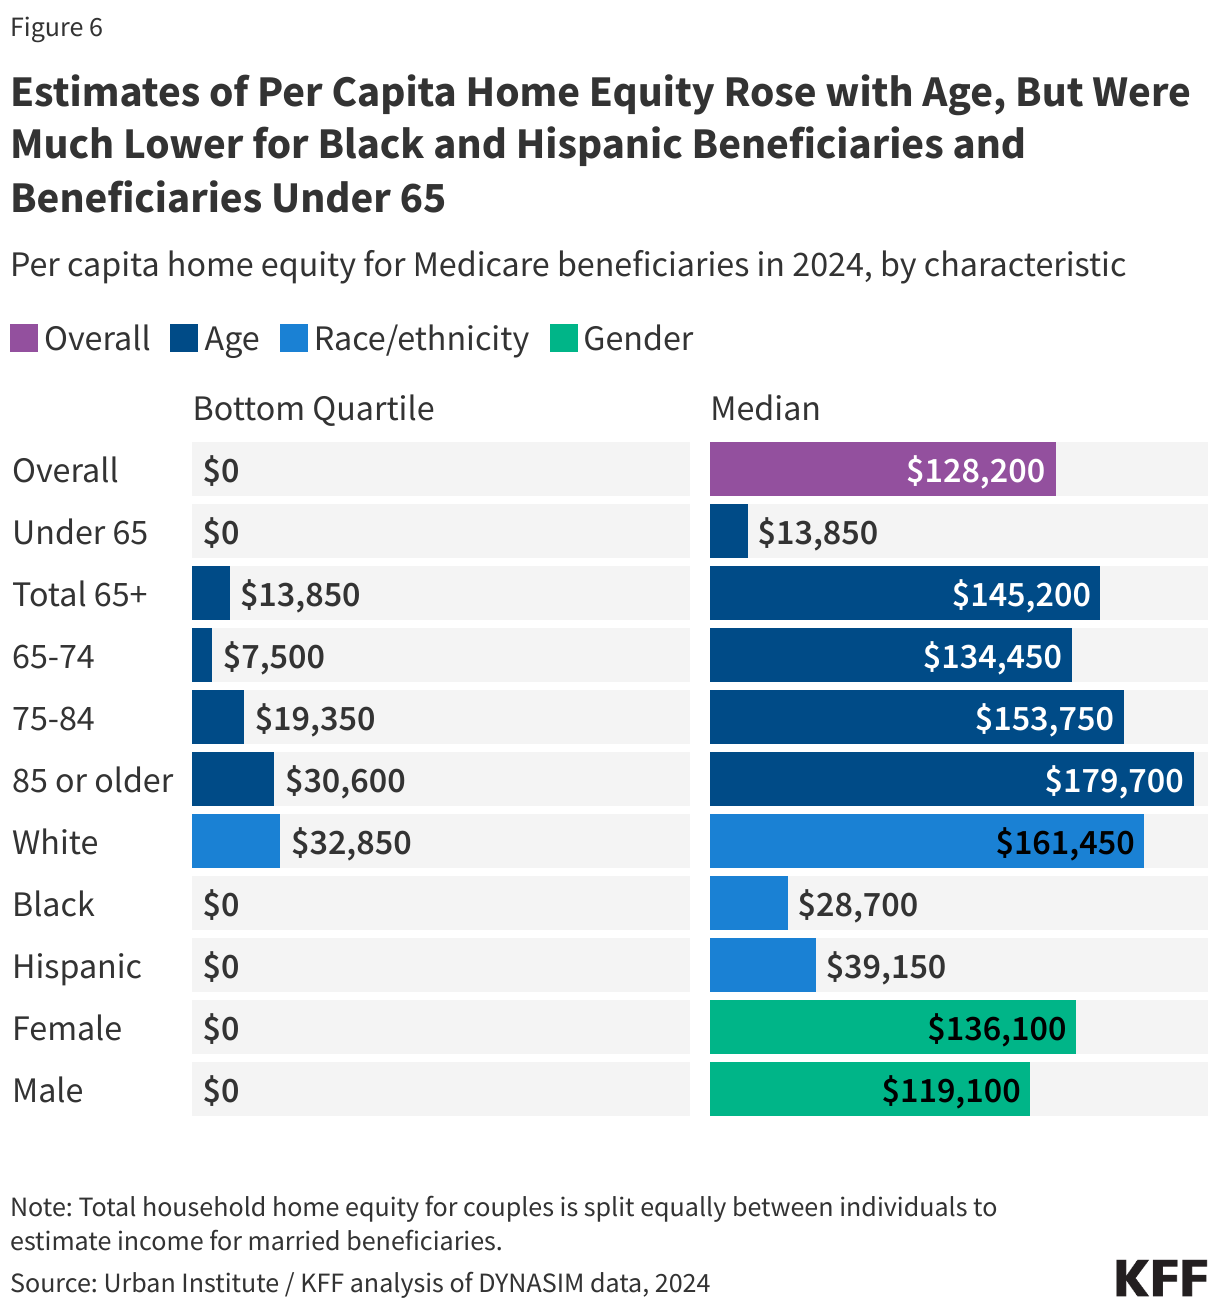
Age Matters: As you age, your home equity generally increases. The median per capita home equity rises from $134,450 for those aged 65-74 to $179,700 for those 85 and older. This is largely due to mortgage paydown and equity accumulation over time.
Home Equity as a Long-Term Investment: Unlike some financial assets that may decline during retirement, homes typically gain equity over time.
significant Disparities for Younger Beneficiaries: Beneficiaries under 65 have substantially lower median home equity ($13,850) compared to seniors ($145,200). Nearly half (48%) of those under 65 have no home equity at all, compared to 23% of seniors.
The Impact of Race and Ethnicity
Racial and ethnic disparities in homeownership are well-documented, and these translate directly into differences in home equity.
White Beneficiaries lead: White beneficiaries have the highest median per capita home equity at $161,450. Significant Gaps for Black and Hispanic Beneficiaries: Black beneficiaries have a median of $28,700, while Hispanic beneficiaries have $39,150.
Homeownership Rates: These differences are partly driven by homeownership rates. 44% of black and 42% of Hispanic Medicare beneficiaries have no home equity, compared to just 20% of White beneficiaries.
Other Factors Influencing Home Equity
Beyond age and race, several other factors play a role in determining your home equity:
Gender: Women have slightly higher median home equity ($136,100) than men ($119,100). This is likely linked to longer life expectancies,allowing more time to accumulate equity and,in cases of widowhood,full home ownership.
Marital Status:
Married & Widowed: These groups generally have higher home equity ($151,500 and $221,350 respectively). A small percentage (13% and 20%) have no equity.
Divorced: Median equity is $54,600,with 41% not owning a home.
Single: Single beneficiaries have the lowest rates of homeownership and the lowest median equity – often $0,with 64% having no equity. Education: As with income and savings, higher education levels correlate with greater home equity.
College Degree: $236,950 median equity, with 16% having no equity.
Less Than High School: $8,650 median equity, and nearly half (48%) are not homeowners.
What Does This Mean for You?
These findings highlight the importance of considering home equity as a critical component of retirement security. For many, it represents a substantial asset. However,
Worth a look