
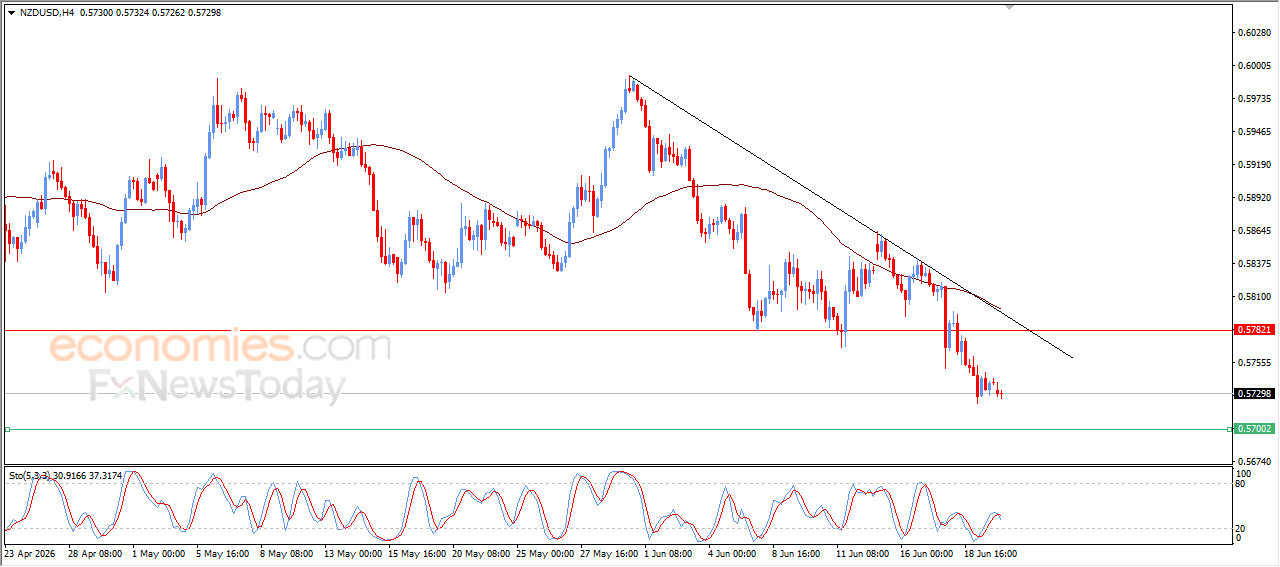
The New Zealand Dollar has reached a two-month low against the U.S. Dollar as the NZD/USD pair faces intense selling pressure. Market analysts report that the pair is trading below key moving averages and testing critical support levels, with the 0.5700 mark serving as a primary focus for traders amid sustained greenback strength.
The New Zealand Dollar, often referred to as the “Kiwi” in foreign exchange markets, has struggled to maintain its footing against a resilient U.S. Dollar. According to data from VT Markets, the NZD/USD pair has dropped to its lowest point in two months. This decline comes as the U.S. Dollar continues to exert dominance in the global currency markets, pushing the Kiwi below several major technical moving averages.
Technical indicators suggest a bearish trend for the pair. FXStreet reports that the NZD/USD is currently trading below its 200-day simple moving average (SMA), a signal that many institutional traders interpret as a long-term trend shift toward the downside. As the pair loses momentum, market participants are closely watching the 0.5700 support level to see if the currency can find a floor or if further depreciation is imminent.
Technical Breakdown of the NZD/USD Pair
The recent price action in the NZD/USD exchange rate has been characterized by sharp downward movements. Technical analysis provided by the news network Shabakat التواصل indicates that the pair has responded strongly to a Fibonacci retracement level of 0.318. This reaction suggests that sellers are stepping in at specific technical thresholds, accelerating the current downward trajectory.
When a currency pair breaks below its 200-day simple moving average, it often signals a change in the prevailing market sentiment. For the New Zealand Dollar, staying below this average indicates that the short-term and medium-term momentum is firmly in favor of the U.S. Dollar. Traders often use the 200-day SMA to distinguish between a temporary correction and a broader trend reversal.
The focus on the 0.5700 level is significant for both retail and institutional traders. In technical analysis, support levels represent price points where buying interest is expected to be strong enough to overcome selling pressure. If the NZD/USD fails to hold the 0.5700 mark, analysts suggest the pair could seek even lower valuation levels in the coming sessions.
British Pound vs. New Zealand Dollar Technical Patterns
The weakness in the New Zealand Dollar is not limited to its relationship with the U.S. Dollar. The GBP/NZD pair is also exhibiting specific technical structures that may influence upcoming price movements. According to reporting from Investing.com, the GBP/NZD exchange rate is currently caught within a “head and shoulders” pattern on the hourly timeframe.
A head and shoulders pattern is a technical chart pattern that typically signals a trend reversal. In the context of GBP/NZD, this pattern suggests that the previous upward momentum for the New Zealand Dollar against the British Pound may be exhausting. If the pattern completes its formation, it could lead to a further decline in the value of the Kiwi relative to the Pound.
The emergence of this pattern on shorter timeframes, such as the one-hour chart, often indicates immediate volatility. Traders monitoring these patterns look for a “neckline” break to confirm the reversal. A break below this line would typically trigger increased selling activity as the market adjusts to the new trend direction.
Economic Drivers and Interest Rate Differentials
While technical levels provide a map of recent price action, the underlying economic fundamentals drive the long-term direction of the NZD/USD. The strength of the U.S. Dollar is often tied to the monetary policy stance of the Federal Reserve. When the Federal Reserve maintains higher interest rates or signals a “higher for longer” approach to combat inflation, the U.S. Dollar tends to appreciate against most global currencies.
Conversely, the New Zealand Dollar is highly sensitive to the policy decisions of the Reserve Bank of New Zealand (RBNZ). If the RBNZ adopts a more dovish stance—meaning it is more likely to cut interest rates or pause hikes—the interest rate differential between the U.S. and New Zealand narrows. A narrower gap makes the New Zealand Dollar less attractive to “carry traders” who seek higher yields in foreign currencies, thereby exerting downward pressure on the Kiwi.
Furthermore, as a commodity-linked currency, the New Zealand Dollar is influenced by global risk sentiment and commodity prices. In periods of economic uncertainty or when investors move toward “safe-haven” assets like the U.S. Dollar, high-beta currencies such as the NZD often face liquidation. This movement is a common characteristic of global market cycles where capital flows away from emerging or smaller economies toward the perceived stability of the United States.
Comparison of Technical Signals
To understand the current market state, it is helpful to compare the different technical signals currently active in the NZD/USD and GBP/NZD markets. The following table summarizes the divergent and convergent signals reported by major financial outlets:
| Indicator/Pattern | Currency Pair | Signal Direction | Source |
|---|---|---|---|
| 200-Day SMA | NZD/USD | Bearish (Below Average) | VT Markets |
| Fibonacci Retracement (0.318) | NZD/USD | Bearish Response | Shabakat التواصل |
| Head and Shoulders | GBP/NZD | Potential Reversal (Downside) | Investing.com |
| Key Support Level | NZD/USD | Focus on 0.5700 | FXStreet |
This comparison shows a high degree of convergence in the bearish sentiment. Both the NZD/USD and the GBP/NZD are displaying patterns that suggest the New Zealand Dollar is under significant pressure, whether through moving average breaches or classic chart reversals.
Frequently Asked Questions
Why is the New Zealand Dollar falling against the U.S. Dollar?
The decline is primarily driven by the strength of the U.S. Dollar and technical factors. The NZD/USD has fallen below its 200-day moving average, and the market is reacting to interest rate differentials between the Federal Reserve and the Reserve Bank of New Zealand.

What technical levels should traders watch for NZD/USD?
Traders are currently focusing on the 0.5700 support level. Additionally, the 0.318 Fibonacci retracement level has recently played a role in price volatility.
What does the “head and shoulders” pattern mean for GBP/NZD?
A head and shoulders pattern is a technical signal that often indicates a trend reversal. On the hourly chart for GBP/NZD, it suggests that the New Zealand Dollar may continue to weaken against the British Pound.
Market participants should look to the next scheduled release of economic data from the Reserve Bank of New Zealand or the U.S. Bureau of Labor Statistics for signals that could shift this current momentum. Official central bank communications remain the most critical checkpoint for determining the future direction of these currency pairs.
What are your thoughts on the NZD/USD’s ability to hold the 0.5700 level? Let us know in the comments below and share this analysis with your network.