
The National Oceanic and Atmospheric Administration (NOAA) has confirmed the return of El Niño, a periodic climate pattern characterized by warmer-than-average sea surface temperatures in the central and eastern Pacific Ocean. This transition from neutral conditions to an El Niño phase carries significant implications for global weather patterns, agricultural output, and commodity markets. Meteorologists and climate scientists are currently monitoring the phenomenon’s intensity, with some modeling suggesting the potential for significant climate disruptions through the coming year.
According to the NOAA Climate Prediction Center, El Niño officially emerged in June 2023. While the intensity of such events varies, the scientific community is focused on how this specific cycle may influence global temperature averages and precipitation distribution. Understanding the reach of the strongest El Niño this century requires examining its historical precedents and the immediate economic and environmental risks it poses to global infrastructure.
Understanding the El Niño-Southern Oscillation
El Niño is the warm phase of the El Niño-Southern Oscillation (ENSO), a natural climate cycle that influences weather globally. During this phase, trade winds—which typically push warm water from the Americas toward Asia—weaken. This allows warm water to accumulate in the central and eastern Pacific, shifting atmospheric circulation patterns. The World Meteorological Organization (WMO) notes that these shifts often result in higher global temperatures and altered rainfall patterns, contributing to both localized flooding and prolonged drought conditions in different regions of the globe.

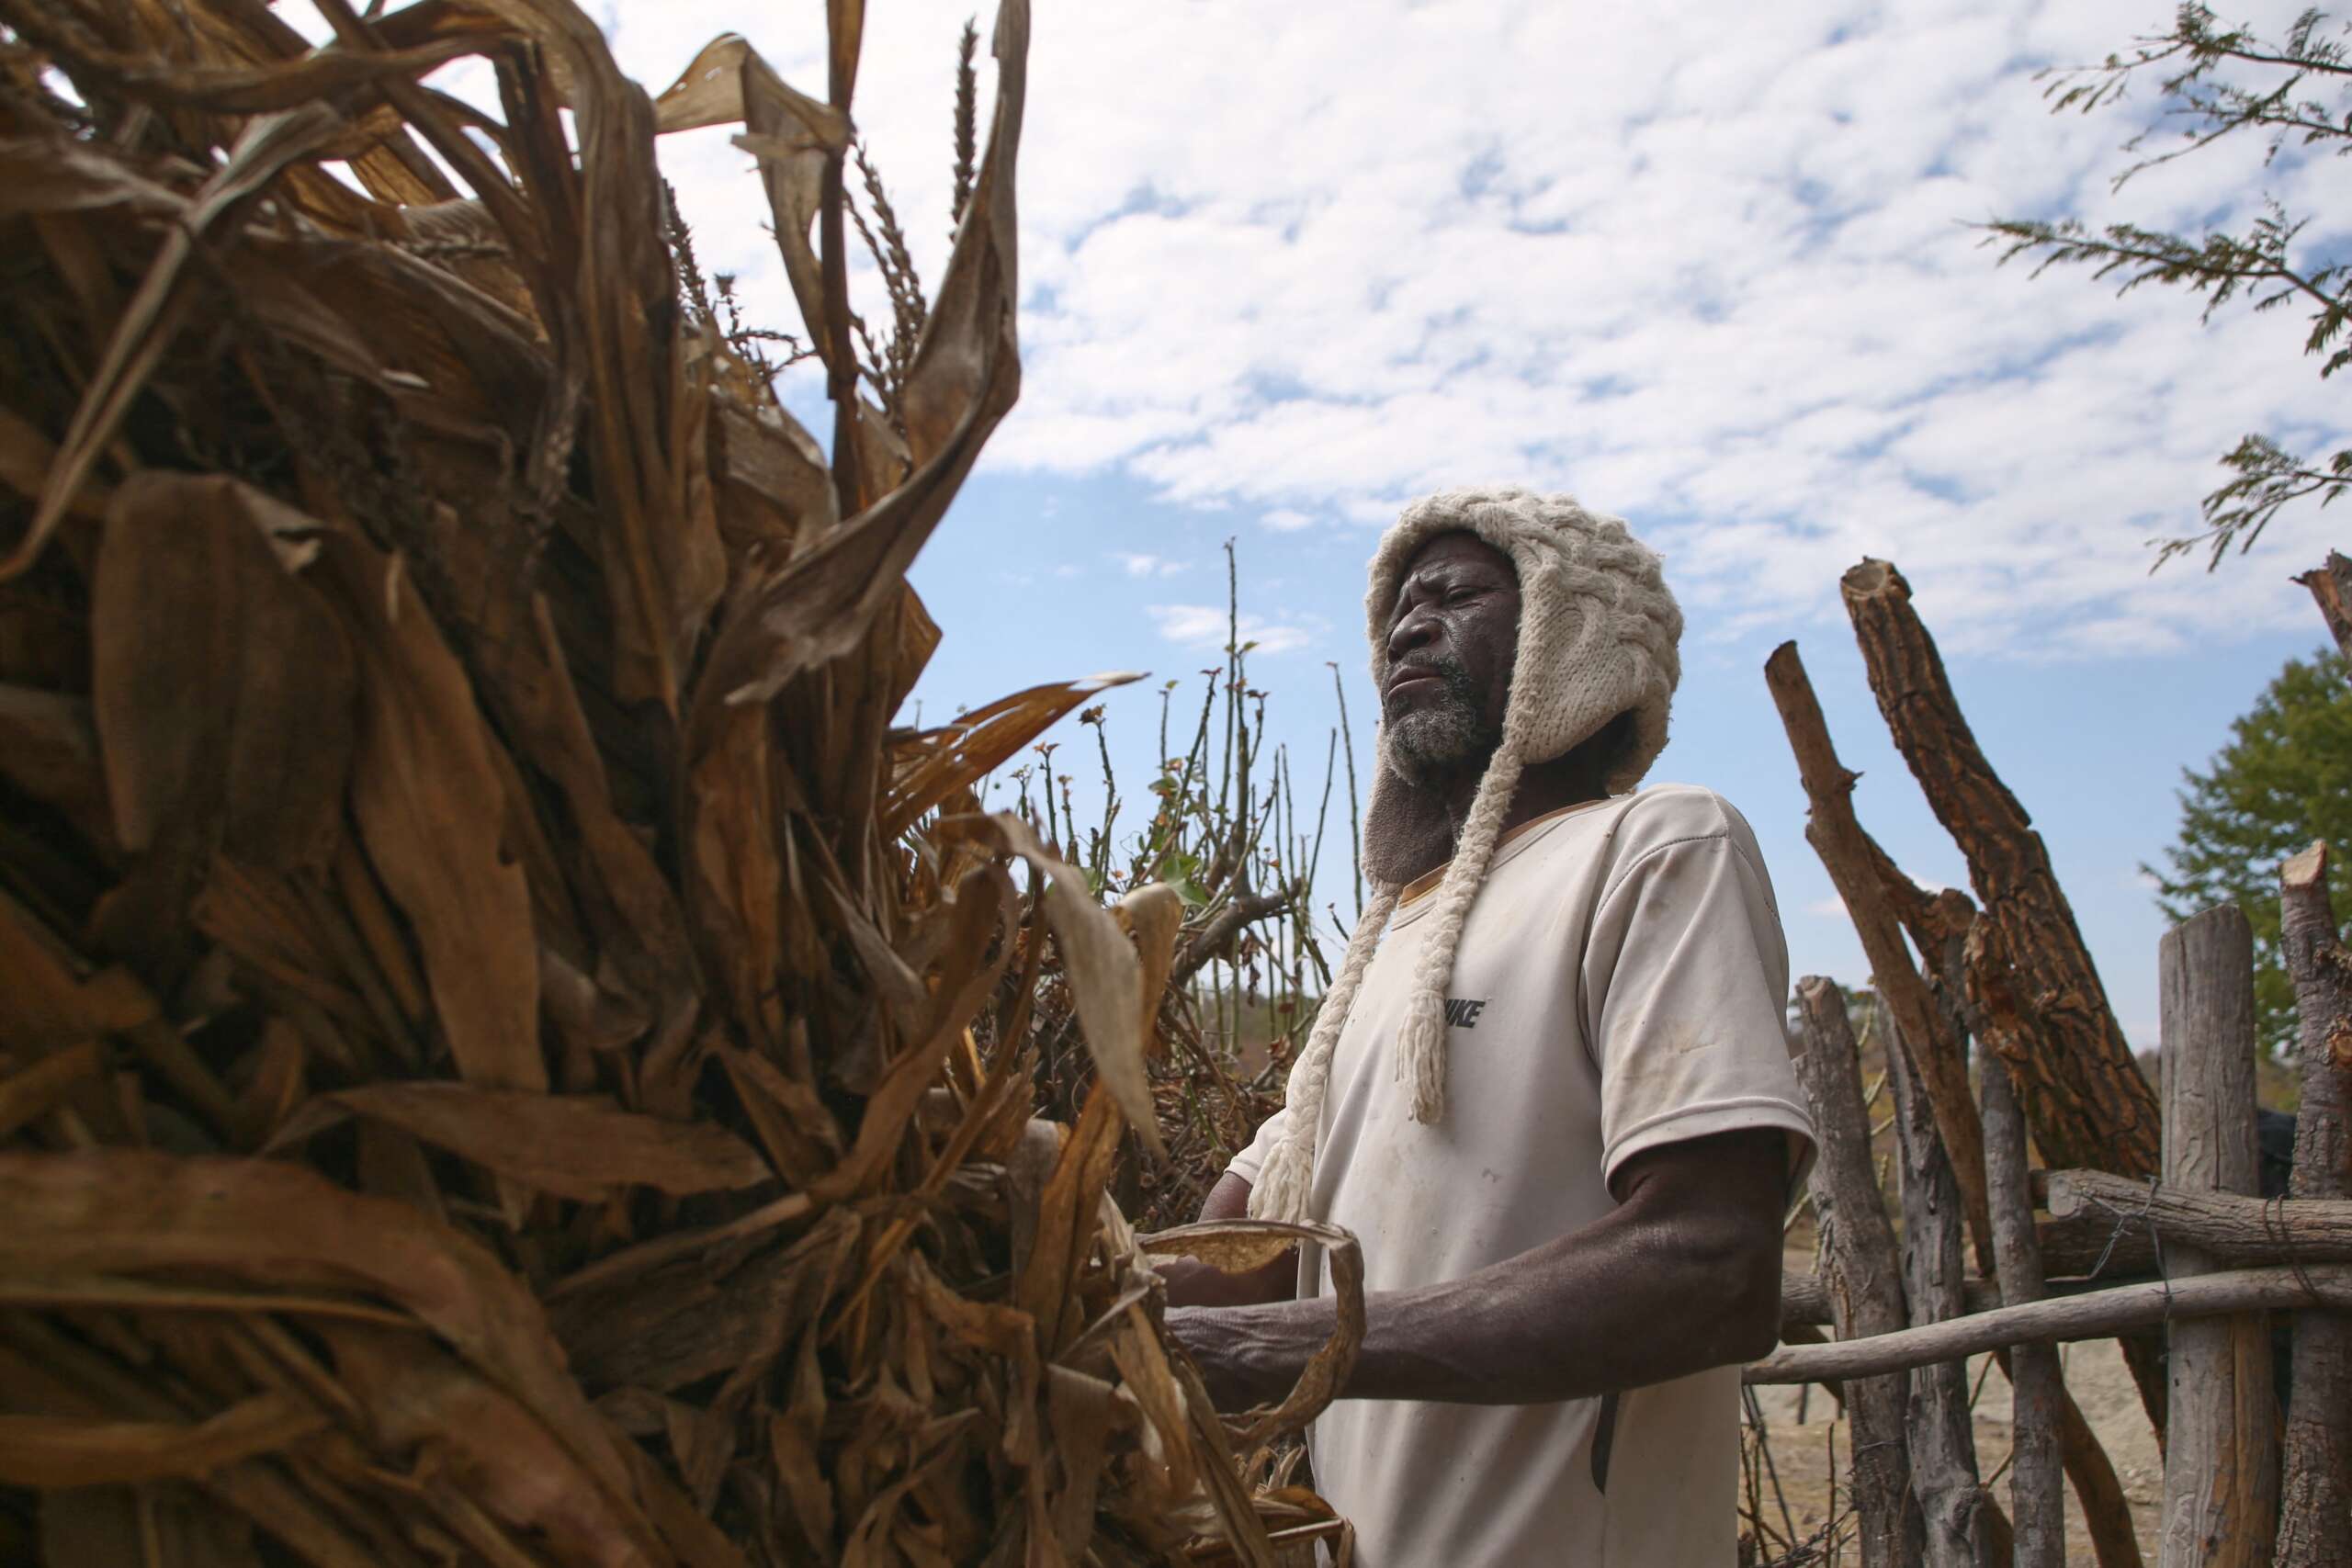
The impact of El Niño on agriculture is a primary concern for financial analysts and policy makers. In regions such as Southeast Asia and parts of Australia, El Niño is historically associated with drier conditions, which can stress crops like rice, palm oil, and wheat. Conversely, parts of South America often experience increased rainfall, which can disrupt logistics and harvest cycles. According to the Food and Agriculture Organization (FAO), these shifts in weather patterns are significant variables in global food security and commodity price volatility.
Economic Implications for Global Markets
The economic footprint of a strong El Niño extends beyond agriculture. Energy demand often fluctuates as extreme temperatures drive higher usage for cooling, impacting electricity grids and natural gas consumption. Financial markets frequently monitor these developments because weather-driven supply shocks can influence inflation rates and central bank policies, particularly in developing economies heavily reliant on agricultural exports.

Historical data provides a framework for assessing potential risks. The International Monetary Fund (IMF) has published research indicating that El Niño events can lead to a measurable increase in global commodity price inflation. For investors, the challenge lies in the uncertainty of the event’s duration and peak intensity. As of the most recent updates, meteorological organizations continue to refine their forecasts, emphasizing that while the current phase is well-documented, the precise magnitude of its secondary effects remains subject to ongoing analysis.
Comparing Current Observations to Historical Records
To determine if this iteration will become the strongest El Niño this century, meteorologists compare current sea surface temperature anomalies against historical benchmarks, such as the events of 1997–1998 and 2015–2016. The NOAA National Centers for Environmental Information maintains datasets tracking these fluctuations. While current models show significant warming, the classification of “strongest” depends on the cumulative heat content and the persistence of the anomaly over several months.
The following table summarizes the variance in reporting regarding climate impact and ENSO strength:
| Metric | Historical High (1997-1998) | Current Observation (2023-2024) |
|---|---|---|
| Sea Surface Anomaly | +2.5°C (Peak) | Tracking significant deviations |
| Primary Impact | Global Temp Spikes | Increased Heat & Precipitation |
| Data Source | NOAA Historical Records | WMO/NOAA Real-time monitoring |
What Happens Next for Global Infrastructure
As the atmospheric and oceanic systems continue to adjust, the focus of international agencies is on disaster preparedness and climate adaptation. Governments are utilizing long-range forecasts to manage water resources and energy reserves. According to the United Nations Office for Disaster Risk Reduction (UNDRR), proactive management of climate-sensitive infrastructure can mitigate the economic damage caused by extreme weather events associated with ENSO cycles.

The next major checkpoint for assessing the evolution of this phenomenon will be the release of the updated seasonal climate outlooks from the WMO and NOAA, which are published on a monthly basis. These reports provide the most accurate data for businesses and governments planning for the remainder of the cycle. Readers are encouraged to monitor these official channels for real-time updates and to share this information with their networks to ensure widespread awareness of the ongoing climate developments.