Evaluating the Long-Term Impact of the NHS Diabetes Prevention Program: A Rigorous Analysis of Type 2 Diabetes and Long-Term Condition Incidence
The National health Service (NHS) Diabetes Prevention Programme (NDPP) represents a significant investment in preventative healthcare, aiming to reduce the rising tide of Type 2 Diabetes (T2D) and associated long-term conditions. But how effective is it, and what are the sustained benefits for participants? This article delves into a detailed analysis of the NDPP’s impact, examining its influence on T2D incidence and the progress of other long-term conditions over varying follow-up periods. We’ll explore the methodology used in a recent study,the key findings,and what these results mean for the future of diabetes prevention strategies.
Understanding the Study Design: A Cohort Approach to Real-World Evidence
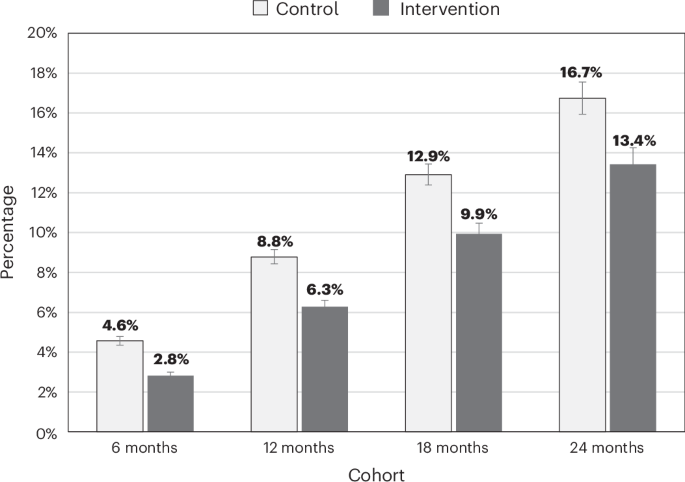
Assessing the effectiveness of a large-scale programme like the NDPP requires a robust and carefully designed study. Researchers recently undertook a thorough evaluation, employing a cohort study approach to track participants over time. This involved following four distinct cohorts, each defined by the length of follow-up: 24 months, 18 months, 12 months, and 6 months.
Crucially,the study wasn’t simply about enrolling everyone and tracking them. A rigorous selection process ensured the data reflected the actual impact of the program on those who were eligible and had sufficient follow-up time. Specifically, individuals were included only if they had started the NDPP intervention before specific dates corresponding to each cohort’s follow-up period (March 2018 for 24-month follow-up, September 2018 for 18-month, March 2019 for 12-month, and September 2019 for 6-month). This careful approach minimizes bias and provides a more accurate picture of the program’s effects. A detailed outline of the selection process and exclusion criteria can be found in Supplementary Fig. 1.
Ensuring fair Comparison: Addressing Potential Biases
Recognizing that simply comparing outcomes between those who participated in the NDPP and those who didn’t could be misleading,the researchers employed a technique called balance assessment using Standardized Mean Difference (SMD) scores (reference 37). This statistical method helps to ensure that the intervention and control groups were as similar as possible at the start of the study,minimizing the influence of pre-existing differences that could skew the results. essentially, it’s about creating a level playing field for a fair comparison.
Analyzing the Data: Logistic and Negative Binomial Regression Models
To determine the association between NDPP completion and health outcomes, the researchers utilized sophisticated statistical modeling.
Type 2 Diabetes Incidence: Logistic regression models were used to estimate the odds of developing T2D. The analysis was structured in two stages.First,a model considered only group assignment (intervention vs. control) to establish an unadjusted odds ratio. Then, a second, more comprehensive model was built, incorporating a range of factors known to influence diabetes risk – demographic characteristics, clinical data, general practice facts, and even a prediction of program completion probability. This allowed researchers to calculate adjusted odds ratios, providing a more nuanced understanding of the NDPP’s impact, accounting for these other variables. The analysis was repeated for each of the four cohorts (6, 12, 18, and 24 months). Long-Term Condition (LTC) Incidence: The study didn’t stop at T2D. Researchers also investigated the impact of the NDPP on the development of other long-term conditions. Here, they employed negative binomial regression models. This type of model is particularly useful when dealing with count data – in this case, the number of new long-term conditions acquired by participants. Similar to the T2D analysis, models were built with and without adjustment for baseline characteristics.LTCs were categorized into two groups: LTC-L (likely related to diabetes) and LTC-PL (perhaps linked to diabetes).
Digging Deeper: Subgroup Analysis
To further refine the understanding of the NDPP’s effects, the researchers conducted separate analyses based on sex and age group. This allows for the identification of potential differences in program effectiveness across different populations. Conventional t-tests were used to compare continuous data between the intervention and control groups within these subgroups.
Statistical Rigor: Defining Meaning
Throughout the analysis, statistical significance was
Worth a look