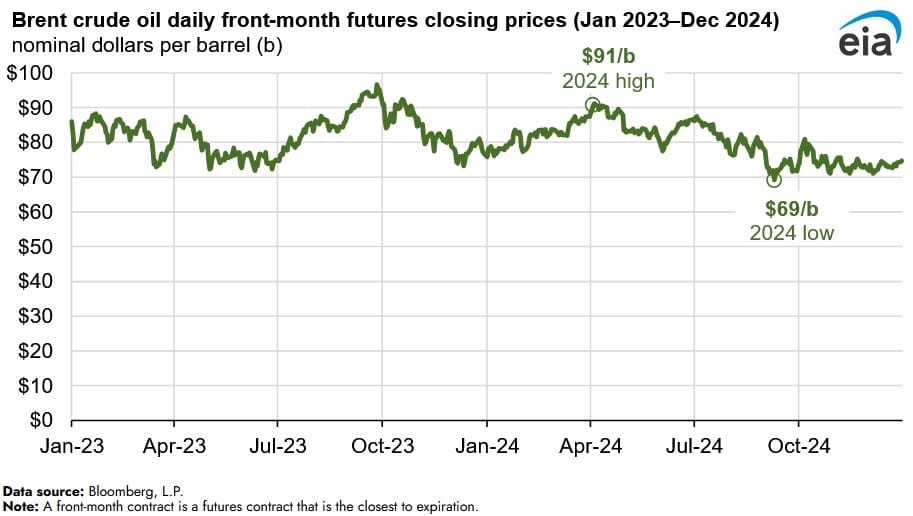
Global energy markets are seeing a shift as crude oil prices dip, with key benchmarks sliding below the psychological threshold of 100 US dollars. In recent trading, the price for a barrel of Brent crude—the primary reference for North Sea oil—was quoted at 98.62 US dollars, representing a 0.74 percent decrease from the previous day.
This downward movement comes amid a complex backdrop of geopolitical volatility and shifting supply chain dynamics. While Brent crude originates from the North Sea, its role as a global pricing anchor means it reacts sharply to events far beyond European waters, particularly tensions in the Middle East and disruptions to critical maritime corridors.
For investors and global industries, these fluctuations are more than just numbers on a screen; they influence everything from transportation costs to the price of heating oil. As the market digests current risks, the interplay between regional conflicts and global demand continues to drive the volatility seen on the ICE and Nymex exchanges.
Understanding Brent Crude as a Global Price Anchor
To the casual observer, it may seem paradoxical that oil priced based on North Sea production would fluctuate due to conflicts in the Middle East. However, Brent is no longer merely a regional price. It has evolved into a global reference price used for approximately two-thirds of the international crude oil trade according to market analysis.
The term “Brent” originally referred to a specific oil field in the British North Sea. Today, the pricing mechanism is more sophisticated, relying on the BFOET basket. This basket includes several North Sea grades: Brent, Forties, Oseberg, Ekofisk, and Troll. By aggregating these sorts, the market creates a more stable and representative benchmark that traders and energy companies worldwide employ to price a vast array of other crude oils.
Because it serves as this universal anchor, any threat to the global supply—such as sanctions, military escalations, or the closure of vital transit points—immediately impacts the Brent price. One of the most sensitive areas in this regard is the Strait of Hormuz, a critical chokepoint for global oil shipments. When risks increase in these regions, traders anticipate potential delivery failures, which typically pushes prices upward regardless of the oil’s physical origin.
The Mechanics of Oil Trading: Futures and Benchmarks
Crude oil is not traded as a simple spot commodity in the way most consumers imagine. Instead, it is primarily traded via futures contracts on major commodity exchanges, specifically the Intercontinental Exchange (ICE) in London and the New York Mercantile Exchange (Nymex) in New York as detailed by market data providers.
These contracts are settled in US dollars per barrel, with one barrel consisting of approximately 159 liters. Traders deal in “front-month” contracts, meaning they trade the contract for the nearest delivery date. For example, a contract for May delivery is traded until the end of March, after which the market “rolls” to the June contract on April 1st.
This rolling process can introduce specific market conditions that analysts watch closely:
- Contango: A market condition where the futures price for delivery in a later month is higher than the current spot price.
- Backwardation: A condition where the current spot price is higher than the futures price for later delivery, often signaling tight immediate supply.
Alongside Brent, the other critical benchmark is West Texas Intermediate (WTI), which represents US-produced light sweet crude. Together, Brent and WTI form the baseline for nearly all global oil price speculations and industrial pricing strategies.
Market Impact and Logistics
The physical movement of these oils is as critical as the financial trading. For instance, light Brent crude is transported from the North Sea via underwater pipelines to the Sullom Voe oil terminal located on the Mainland of Shetland, from where it is loaded onto tankers for global distribution.

When prices dip below 100 US dollars, it often provides a temporary reprieve for importing nations and industries that rely heavily on petroleum-based products. However, the volatility remains high. As of April 14, 2026, market data showed Brent North Sea oil at 98.16 US dollars, showing a slight increase of 0.21 percent, while WTI was trading at 96.19 US dollars, down 1.86 percent per recent exchange values.
Key Oil Market Terms
| Benchmark | Primary Region | Exchange | Characteristics |
|---|---|---|---|
| Brent Crude | North Sea | ICE (London) | Global reference for ~2/3 of trade; BFOET basket. |
| WTI | United States (Texas) | Nymex (New York) | Light Sweet Crude; primary US benchmark. |
The current trend of prices hovering just below the 100-dollar mark suggests a tug-of-war between geopolitical risk premiums and actual market demand. While the threat of supply disruptions in the Middle East supports higher prices, economic data and actual delivery volumes can pull those prices back down.
Market participants continue to monitor the “front-month” contracts closely as they transition through the spring delivery cycles. The next critical checkpoint for traders will be the continued monitoring of delivery contracts and the stability of transit routes in the Middle East, which remain the primary drivers of short-term price volatility.
We invite our readers to share their perspectives on how current energy price volatility is affecting their local markets in the comments section below.
Keep reading