U.S. Hospital Finances Under Pressure: July 2025 Performance Report
By Fred Pennic, Healthcare Finance Analyst
The U.S. healthcare landscape continues to navigate a complex financial environment. A recent report from Strata Decision Technology, analyzing data from over 1,600 hospitals and 135,000 physicians, paints a clear picture: while revenue is growing, rising expenses are squeezing operating margins. Let’s break down the key findings and what they mean for you and your organization.Key Takeaways: A Snapshot of July 2025
Operating Margins Dip: Health system operating margins fell to 0.9% in July 2025. This indicates a tightening financial situation despite consistent revenue gains. Year-to-Date Trends: The median year-to-date operating margin remained at 0.9% – consistent since January, but down from 1.2% in June.
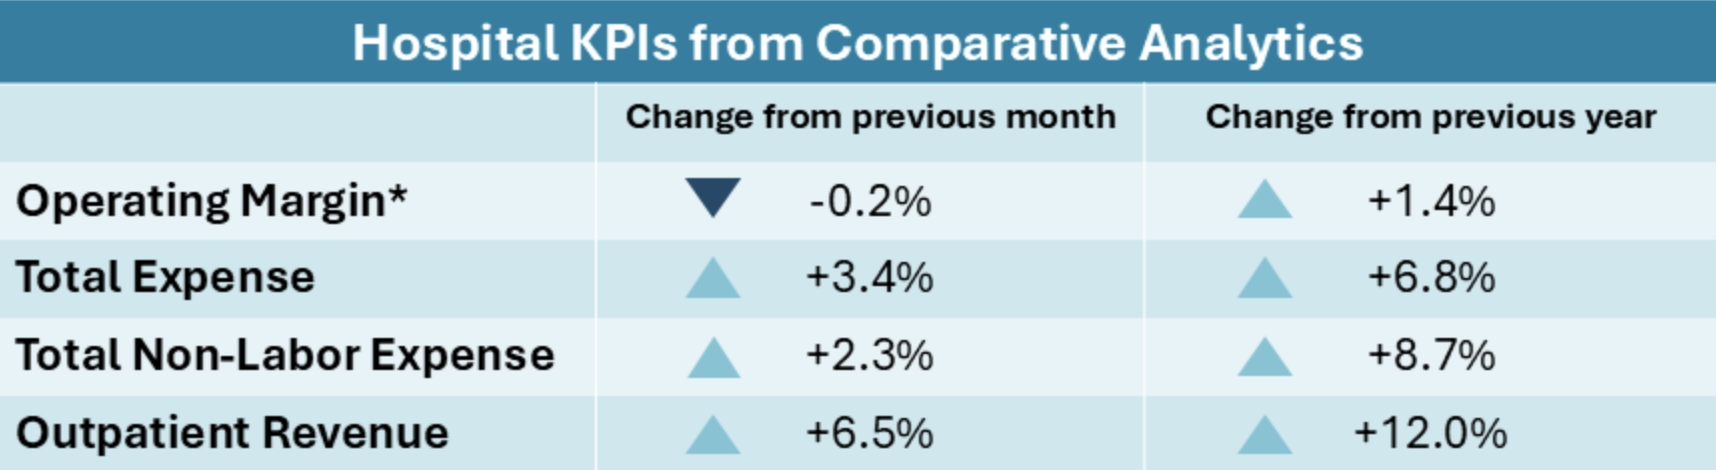
Hospital Margins Improve, but…: U.S. hospitals saw a 1.4% year-over-year increase in operating margin, however, this was offset by a 0.2% month-over-month decline.
Expense Growth Outpaces Revenue: total expenses grew by 6.8% year-over-year, exceeding revenue growth.
The Expense Story: Non-Labor Costs Take the Lead
For many hospitals,the biggest challenge isn’t labor costs – it’s everything else. Non-labor expenses are rising at a significantly faster rate than labor.
Here’s a closer look:
Total Non-Labor Expenses: Increased by 8.7% from july 2024 to July 2025.
labor Expenses: Rose by 5.3% over the same period.
Supply Costs: Climbed a substantial 10.6%.
Drug Costs: Increased by 9.5%. Regional variations: Hospitals in the south experienced the largest increase in non-labor expenses, at 9.5%.
These increases are, in part, attributed to the ongoing impact of federal tariffs. You need to proactively manage your supply chain and explore cost-saving opportunities to mitigate these pressures.
Revenue Growth: Outpatient Services Lead the Way
Despite the expense challenges, hospitals are seeing positive revenue trends. Gross revenues have grown for 27 consecutive months, demonstrating continued patient demand.
Outpatient Revenue: Experienced the largest year-over-year gain, rising 12.0% from July 2024 to July 2025.
inpatient Revenue: Increased by 7.2% over the same period.
Gross Operating Revenue: Grew by 10.6% overall.This shift towards outpatient care is significant. We’re seeing increased demand for convenient, lower-cost settings. Specifically:
upper GI Endoscopy: Increased by 21.2% year-over-year.
Diagnostic Echocardiograms: Were up 20.9% year-over-year.
This trend suggests you shoudl consider investing in and expanding your outpatient service offerings to capitalize on this growing demand.
Physician Practices: A Parallel Struggle
The financial pressures aren’t limited to hospitals. Physician practices are also facing rising expenses and navigating a changing landscape.
Per-Physician expenses: Reached a national median of $1.1 million annually in July, up 6.9% from 2024 and 16.6% from 2023.
Net Patient Service Revenue (NPSR): Increased by 4.7% per physician FTE compared to 2024.
Productivity & Staffing: Physician productivity improved,while support staffing levels decreased.This indicates practices are striving for efficiency,but the rising cost of doing business remains a significant hurdle.
Looking Ahead: What This means for you
The July 2025 data underscores the need for proactive financial management in the healthcare industry. You must focus on:
Related reading